Immigrants from Kenya vs Immigrants from Western Asia 6th Grade
COMPARE
Immigrants from Kenya
Immigrants from Western Asia
6th Grade
6th Grade Comparison
Immigrants from Kenya
Immigrants from Western Asia
97.0%
6TH GRADE
45.3/ 100
METRIC RATING
179th/ 347
METRIC RANK
96.7%
6TH GRADE
4.1/ 100
METRIC RATING
227th/ 347
METRIC RANK
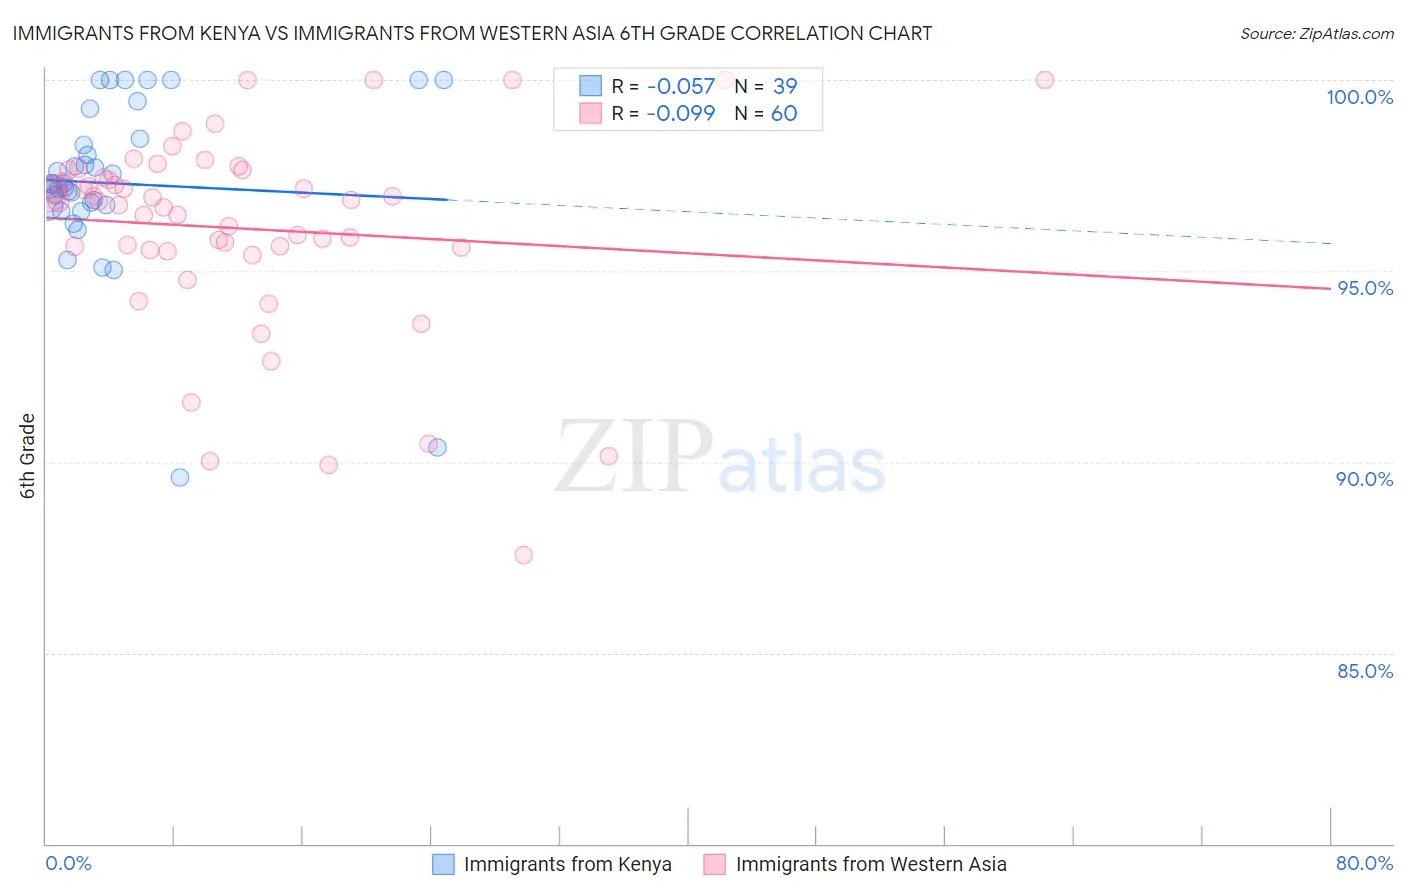
Immigrants from Kenya vs Immigrants from Western Asia 6th Grade Correlation Chart
The statistical analysis conducted on geographies consisting of 218,076,690 people shows a slight negative correlation between the proportion of Immigrants from Kenya and percentage of population with at least 6th grade education in the United States with a correlation coefficient (R) of -0.057 and weighted average of 97.0%. Similarly, the statistical analysis conducted on geographies consisting of 404,389,948 people shows a slight negative correlation between the proportion of Immigrants from Western Asia and percentage of population with at least 6th grade education in the United States with a correlation coefficient (R) of -0.099 and weighted average of 96.7%, a difference of 0.34%.
6th Grade Correlation Summary
| Measurement | Immigrants from Kenya | Immigrants from Western Asia |
| Minimum | 89.6% | 87.6% |
| Maximum | 100.0% | 100.0% |
| Range | 10.4% | 12.4% |
| Mean | 97.3% | 96.1% |
| Median | 97.3% | 96.8% |
| Interquartile 25% (IQ1) | 96.7% | 95.6% |
| Interquartile 75% (IQ3) | 98.5% | 97.5% |
| Interquartile Range (IQR) | 1.7% | 2.0% |
| Standard Deviation (Sample) | 2.2% | 2.6% |
| Standard Deviation (Population) | 2.2% | 2.6% |
Similar Demographics by 6th Grade
Demographics Similar to Immigrants from Kenya by 6th Grade
In terms of 6th grade, the demographic groups most similar to Immigrants from Kenya are Pakistani (97.0%, a difference of 0.0%), Immigrants from Kazakhstan (97.0%, a difference of 0.010%), Immigrants from Micronesia (97.0%, a difference of 0.010%), Mongolian (97.0%, a difference of 0.010%), and Arab (97.0%, a difference of 0.020%).
| Demographics | Rating | Rank | 6th Grade |
| Egyptians | 50.9 /100 | #172 | Average 97.1% |
| Arabs | 50.1 /100 | #173 | Average 97.0% |
| Venezuelans | 50.0 /100 | #174 | Average 97.0% |
| Immigrants | Kazakhstan | 47.3 /100 | #175 | Average 97.0% |
| Immigrants | Micronesia | 47.1 /100 | #176 | Average 97.0% |
| Mongolians | 46.7 /100 | #177 | Average 97.0% |
| Pakistanis | 46.0 /100 | #178 | Average 97.0% |
| Immigrants | Kenya | 45.3 /100 | #179 | Average 97.0% |
| Immigrants | Spain | 39.9 /100 | #180 | Fair 97.0% |
| Comanche | 37.9 /100 | #181 | Fair 97.0% |
| Immigrants | Ukraine | 35.6 /100 | #182 | Fair 97.0% |
| Immigrants | Venezuela | 34.5 /100 | #183 | Fair 97.0% |
| Spanish Americans | 33.5 /100 | #184 | Fair 97.0% |
| Argentineans | 33.0 /100 | #185 | Fair 97.0% |
| Immigrants | Egypt | 31.4 /100 | #186 | Fair 97.0% |
Demographics Similar to Immigrants from Western Asia by 6th Grade
In terms of 6th grade, the demographic groups most similar to Immigrants from Western Asia are Immigrants from Panama (96.7%, a difference of 0.0%), Immigrants from Malaysia (96.7%, a difference of 0.0%), Assyrian/Chaldean/Syriac (96.7%, a difference of 0.0%), Immigrants from Eastern Asia (96.7%, a difference of 0.0%), and Immigrants from Southern Europe (96.7%, a difference of 0.010%).
| Demographics | Rating | Rank | 6th Grade |
| Immigrants | Morocco | 6.2 /100 | #220 | Tragic 96.7% |
| Tongans | 6.1 /100 | #221 | Tragic 96.7% |
| Immigrants | Syria | 5.9 /100 | #222 | Tragic 96.7% |
| Bahamians | 4.8 /100 | #223 | Tragic 96.7% |
| Immigrants | Southern Europe | 4.4 /100 | #224 | Tragic 96.7% |
| Immigrants | Pakistan | 4.4 /100 | #225 | Tragic 96.7% |
| Immigrants | Panama | 4.2 /100 | #226 | Tragic 96.7% |
| Immigrants | Western Asia | 4.1 /100 | #227 | Tragic 96.7% |
| Immigrants | Malaysia | 4.0 /100 | #228 | Tragic 96.7% |
| Assyrians/Chaldeans/Syriacs | 4.0 /100 | #229 | Tragic 96.7% |
| Immigrants | Eastern Asia | 4.0 /100 | #230 | Tragic 96.7% |
| Sub-Saharan Africans | 3.5 /100 | #231 | Tragic 96.7% |
| South American Indians | 3.5 /100 | #232 | Tragic 96.7% |
| Yuman | 3.2 /100 | #233 | Tragic 96.7% |
| Uruguayans | 2.5 /100 | #234 | Tragic 96.6% |