Thai vs Inupiat 6th Grade
COMPARE
Thai
Inupiat
6th Grade
6th Grade Comparison
Thais
Inupiat
97.4%
6TH GRADE
96.9/ 100
METRIC RATING
110th/ 347
METRIC RANK
98.1%
6TH GRADE
100.0/ 100
METRIC RATING
15th/ 347
METRIC RANK
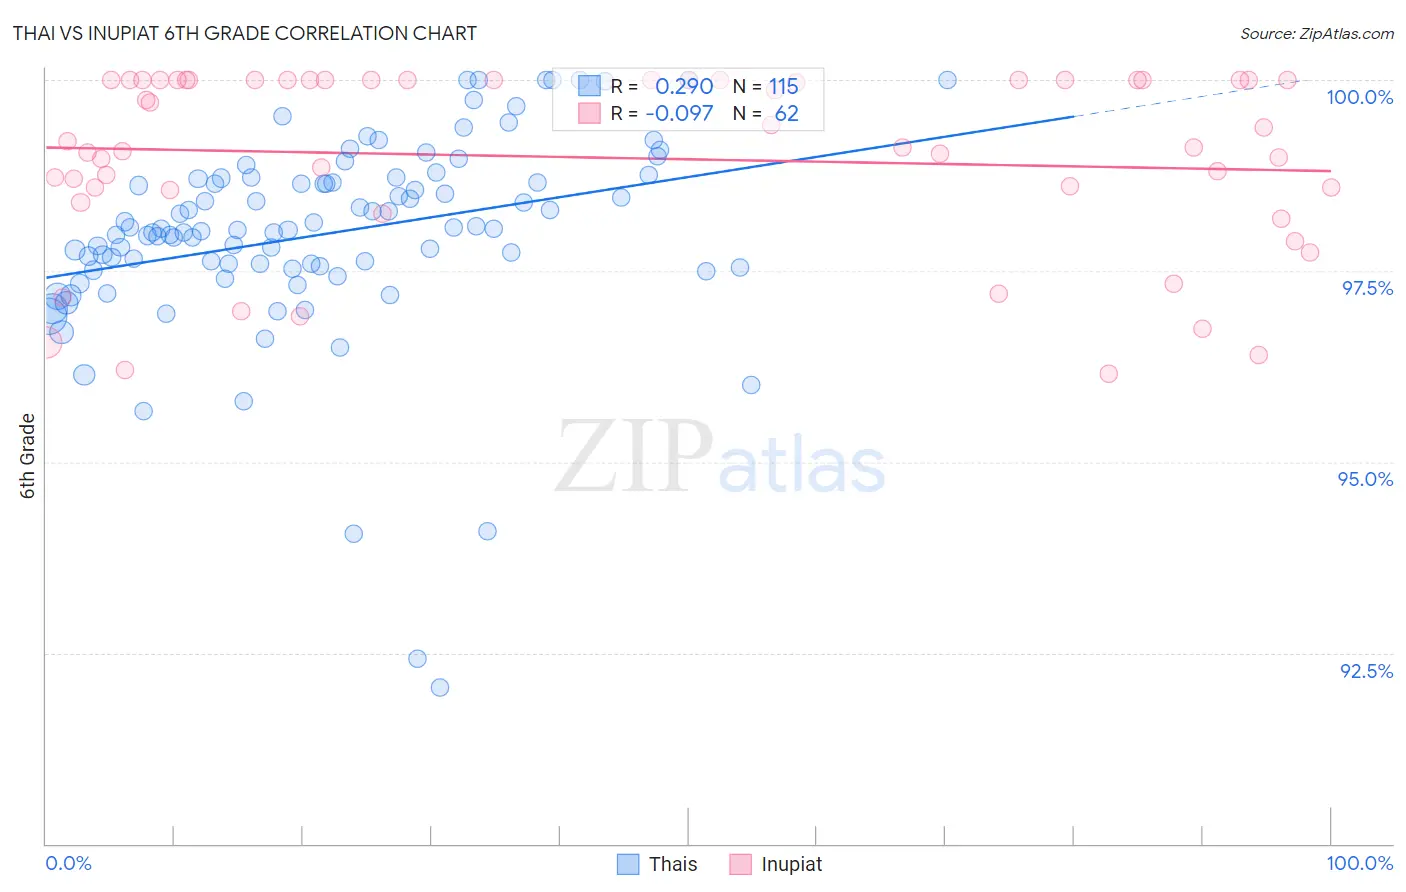
Thai vs Inupiat 6th Grade Correlation Chart
The statistical analysis conducted on geographies consisting of 475,866,115 people shows a weak positive correlation between the proportion of Thais and percentage of population with at least 6th grade education in the United States with a correlation coefficient (R) of 0.290 and weighted average of 97.4%. Similarly, the statistical analysis conducted on geographies consisting of 96,348,974 people shows a slight negative correlation between the proportion of Inupiat and percentage of population with at least 6th grade education in the United States with a correlation coefficient (R) of -0.097 and weighted average of 98.1%, a difference of 0.70%.
6th Grade Correlation Summary
| Measurement | Thai | Inupiat |
| Minimum | 92.1% | 96.2% |
| Maximum | 100.0% | 100.0% |
| Range | 7.9% | 3.8% |
| Mean | 98.0% | 99.0% |
| Median | 98.0% | 99.2% |
| Interquartile 25% (IQ1) | 97.5% | 98.6% |
| Interquartile 75% (IQ3) | 98.7% | 100.0% |
| Interquartile Range (IQR) | 1.2% | 1.4% |
| Standard Deviation (Sample) | 1.3% | 1.2% |
| Standard Deviation (Population) | 1.3% | 1.2% |
Similar Demographics by 6th Grade
Demographics Similar to Thais by 6th Grade
In terms of 6th grade, the demographic groups most similar to Thais are Iroquois (97.4%, a difference of 0.0%), Immigrants from Latvia (97.4%, a difference of 0.010%), Nonimmigrants (97.4%, a difference of 0.020%), Immigrants from Czechoslovakia (97.4%, a difference of 0.020%), and Immigrants from Saudi Arabia (97.4%, a difference of 0.020%).
| Demographics | Rating | Rank | 6th Grade |
| Bhutanese | 98.0 /100 | #103 | Exceptional 97.5% |
| German Russians | 97.9 /100 | #104 | Exceptional 97.5% |
| Cheyenne | 97.9 /100 | #105 | Exceptional 97.5% |
| Menominee | 97.7 /100 | #106 | Exceptional 97.5% |
| Immigrants | Singapore | 97.6 /100 | #107 | Exceptional 97.5% |
| Immigrants | Nonimmigrants | 97.3 /100 | #108 | Exceptional 97.4% |
| Immigrants | Czechoslovakia | 97.3 /100 | #109 | Exceptional 97.4% |
| Thais | 96.9 /100 | #110 | Exceptional 97.4% |
| Iroquois | 96.9 /100 | #111 | Exceptional 97.4% |
| Immigrants | Latvia | 96.7 /100 | #112 | Exceptional 97.4% |
| Immigrants | Saudi Arabia | 96.5 /100 | #113 | Exceptional 97.4% |
| Colville | 96.4 /100 | #114 | Exceptional 97.4% |
| Immigrants | Switzerland | 95.7 /100 | #115 | Exceptional 97.4% |
| Lebanese | 95.5 /100 | #116 | Exceptional 97.4% |
| Basques | 95.4 /100 | #117 | Exceptional 97.4% |
Demographics Similar to Inupiat by 6th Grade
In terms of 6th grade, the demographic groups most similar to Inupiat are Carpatho Rusyn (98.1%, a difference of 0.010%), Scottish (98.1%, a difference of 0.010%), Tlingit-Haida (98.1%, a difference of 0.020%), Polish (98.1%, a difference of 0.020%), and Pennsylvania German (98.1%, a difference of 0.020%).
| Demographics | Rating | Rank | 6th Grade |
| Slovaks | 100.0 /100 | #8 | Exceptional 98.2% |
| Slovenes | 100.0 /100 | #9 | Exceptional 98.2% |
| Swedes | 100.0 /100 | #10 | Exceptional 98.2% |
| English | 100.0 /100 | #11 | Exceptional 98.1% |
| Alaskan Athabascans | 100.0 /100 | #12 | Exceptional 98.1% |
| Tlingit-Haida | 100.0 /100 | #13 | Exceptional 98.1% |
| Carpatho Rusyns | 100.0 /100 | #14 | Exceptional 98.1% |
| Inupiat | 100.0 /100 | #15 | Exceptional 98.1% |
| Scottish | 100.0 /100 | #16 | Exceptional 98.1% |
| Poles | 100.0 /100 | #17 | Exceptional 98.1% |
| Pennsylvania Germans | 100.0 /100 | #18 | Exceptional 98.1% |
| Irish | 100.0 /100 | #19 | Exceptional 98.1% |
| Finns | 100.0 /100 | #20 | Exceptional 98.1% |
| Lithuanians | 100.0 /100 | #21 | Exceptional 98.1% |
| Danes | 100.0 /100 | #22 | Exceptional 98.0% |