French vs Immigrants from Western Asia 6th Grade

COMPARE

French
Race
Ancestry
AfghanAfricanAlaska NativeAlaskan AthabascanAlbanianAleutAlsatianAmericanApacheArabArapahoArgentineanArmenianAssyrian/Chaldean/SyriacAustralianAustrianBahamianBangladeshiBarbadianBasqueBelgianBelizeanBermudanBhutaneseBlackfeetBolivianBrazilianBritishBritish West IndianBulgarianBurmeseCajunCambodianCanadianCape VerdeanCarpatho RusynCelticCentral AmericanCentral American IndianCherokeeCheyenneChickasawChileanChineseChippewaChoctawColombianColvilleComancheCosta RicanCreeCreekCroatianCrowCubanCypriotCzechCzechoslovakianDanishDelawareDominicanDutchDutch West IndianEastern EuropeanEcuadorianEgyptianEnglishEstonianEthiopianEuropeanFijianFilipinoFinnishFrenchFrench American IndianFrench CanadianGermanGerman RussianGhanaianGreekGuamanian/ChamorroGuatemalanGuyaneseHaitianHmongHonduranHopiHoumaHungarianIcelanderIndian (Asian)IndonesianInupiatIranianIraqiIrishIroquoisIsraeliItalianJamaicanJapaneseJordanianKenyanKiowaKoreanLaotianLatvianLebaneseLiberianLithuanianLumbeeLuxembourgerMacedonianMalaysianMalteseMarshalleseMenomineeMexicanMexican American IndianMongolianMoroccanNative HawaiianNavajoNepaleseNew ZealanderNicaraguanNigerianNorthern EuropeanNorwegianOkinawanOsageOttawaPaiutePakistaniPalestinianPanamanianParaguayanPennsylvania GermanPeruvianPimaPolishPortuguesePotawatomiPuebloPuerto RicanPuget Sound SalishRomanianRussianSalvadoranSamoanScandinavianScotch-IrishScottishSeminoleSenegaleseSerbianShoshoneSierra LeoneanSiouxSlavicSlovakSloveneSomaliSouth AfricanSouth AmericanSouth American IndianSoviet UnionSpaniardSpanishSpanish AmericanSpanish American IndianSri LankanSubsaharan AfricanSudaneseSwedishSwissSyrianTaiwaneseThaiTlingit-HaidaTohono O'OdhamTonganTrinidadian and TobagonianTsimshianTurkishU.S. Virgin IslanderUgandanUkrainianUruguayanUteVenezuelanVietnameseWelshWest IndianYakamaYaquiYugoslavianYumanYup'ikZimbabwean
Immigration
NonimmigrantsImmigrantsAfghanistanAfricaAlbaniaArgentinaArmeniaAsiaAustraliaAustriaBahamasBangladeshBarbadosBelarusBelgiumBelizeBoliviaBosnia and HerzegovinaBrazilBulgariaBurma/MyanmarCabo VerdeCambodiaCameroonCanadaCaribbeanCentral AmericaChileChinaColombiaCongoCosta RicaCroatiaCubaCzechoslovakiaDenmarkDominicaDominican RepublicEastern AfricaEastern AsiaEastern EuropeEcuadorEgyptEl SalvadorEnglandEritreaEthiopiaEuropeFijiFranceGermanyGhanaGreeceGrenadaGuatemalaGuyanaHaitiHondurasHong KongHungaryIndiaIndonesiaIranIraqIrelandIsraelItalyJamaicaJapanJordanKazakhstanKenyaKoreaKuwaitLaosLatin AmericaLatviaLebanonLiberiaLithuaniaMalaysiaMexicoMicronesiaMiddle AfricaMoldovaMoroccoNepalNetherlandsNicaraguaNigeriaNorth AmericaNorth MacedoniaNorthern AfricaNorthern EuropeNorwayOceaniaPakistanPanamaPeruPhilippinesPolandPortugalRomaniaRussiaSaudi ArabiaScotlandSenegalSerbiaSierra LeoneSingaporeSomaliaSouth AfricaSouth AmericaSouth Central AsiaSouth Eastern AsiaSouthern EuropeSpainSri LankaSt. Vincent and the GrenadinesSudanSwedenSwitzerlandSyriaTaiwanThailandTrinidad and TobagoTurkeyUgandaUkraineUruguayUzbekistanVenezuelaVietnamWest IndiesWestern AfricaWestern EuropeYemenZaireZimbabweAzores
Immigrants from Western Asia
Race
Ancestry
AfghanAfricanAlaska NativeAlaskan AthabascanAlbanianAleutAlsatianAmericanApacheArabArapahoArgentineanArmenianAssyrian/Chaldean/SyriacAustralianAustrianBahamianBangladeshiBarbadianBasqueBelgianBelizeanBermudanBhutaneseBlackfeetBolivianBrazilianBritishBritish West IndianBulgarianBurmeseCajunCambodianCanadianCape VerdeanCarpatho RusynCelticCentral AmericanCentral American IndianCherokeeCheyenneChickasawChileanChineseChippewaChoctawColombianColvilleComancheCosta RicanCreeCreekCroatianCrowCubanCypriotCzechCzechoslovakianDanishDelawareDominicanDutchDutch West IndianEastern EuropeanEcuadorianEgyptianEnglishEstonianEthiopianEuropeanFijianFilipinoFinnishFrench American IndianFrench CanadianGermanGerman RussianGhanaianGreekGuamanian/ChamorroGuatemalanGuyaneseHaitianHmongHonduranHopiHoumaHungarianIcelanderIndian (Asian)IndonesianInupiatIranianIraqiIrishIroquoisIsraeliItalianJamaicanJapaneseJordanianKenyanKiowaKoreanLaotianLatvianLebaneseLiberianLithuanianLumbeeLuxembourgerMacedonianMalaysianMalteseMarshalleseMenomineeMexicanMexican American IndianMongolianMoroccanNative HawaiianNavajoNepaleseNew ZealanderNicaraguanNigerianNorthern EuropeanNorwegianOkinawanOsageOttawaPaiutePakistaniPalestinianPanamanianParaguayanPennsylvania GermanPeruvianPimaPolishPortuguesePotawatomiPuebloPuerto RicanPuget Sound SalishRomanianRussianSalvadoranSamoanScandinavianScotch-IrishScottishSeminoleSenegaleseSerbianShoshoneSierra LeoneanSiouxSlavicSlovakSloveneSomaliSouth AfricanSouth AmericanSouth American IndianSoviet UnionSpaniardSpanishSpanish AmericanSpanish American IndianSri LankanSubsaharan AfricanSudaneseSwedishSwissSyrianTaiwaneseThaiTlingit-HaidaTohono O'OdhamTonganTrinidadian and TobagonianTsimshianTurkishU.S. Virgin IslanderUgandanUkrainianUruguayanUteVenezuelanVietnameseWelshWest IndianYakamaYaquiYugoslavianYumanYup'ikZimbabwean
Immigration
NonimmigrantsImmigrantsAfghanistanAfricaAlbaniaArgentinaArmeniaAsiaAustraliaAustriaBahamasBangladeshBarbadosBelarusBelgiumBelizeBoliviaBosnia and HerzegovinaBrazilBulgariaBurma/MyanmarCabo VerdeCambodiaCameroonCanadaCaribbeanCentral AmericaChileChinaColombiaCongoCosta RicaCroatiaCubaCzechoslovakiaDenmarkDominicaDominican RepublicEastern AfricaEastern AsiaEastern EuropeEcuadorEgyptEl SalvadorEnglandEritreaEthiopiaEuropeFijiFranceGermanyGhanaGreeceGrenadaGuatemalaGuyanaHaitiHondurasHong KongHungaryIndiaIndonesiaIranIraqIrelandIsraelItalyJamaicaJapanJordanKazakhstanKenyaKoreaKuwaitLaosLatin AmericaLatviaLebanonLiberiaLithuaniaMalaysiaMexicoMicronesiaMiddle AfricaMoldovaMoroccoNepalNetherlandsNicaraguaNigeriaNorth AmericaNorth MacedoniaNorthern AfricaNorthern EuropeNorwayOceaniaPakistanPanamaPeruPhilippinesPolandPortugalRomaniaRussiaSaudi ArabiaScotlandSenegalSerbiaSierra LeoneSingaporeSomaliaSouth AfricaSouth AmericaSouth Central AsiaSouth Eastern AsiaSouthern EuropeSpainSri LankaSt. Vincent and the GrenadinesSudanSwedenSwitzerlandSyriaTaiwanThailandTrinidad and TobagoTurkeyUgandaUkraineUruguayUzbekistanVenezuelaVietnamWest IndiesWestern AfricaWestern AsiaWestern EuropeYemenZaireZimbabweAzores
6th Grade
Income
Poverty
Unemployment
Labor Participation
Family Structure
Vehicle Availability
Education Level
Disability

6th Grade Comparison

French

Immigrants from Western Asia

Exceptional
Tragic
98.0%
6TH GRADE
100.0/ 100
METRIC RATING
29th/ 347
METRIC RANK
96.7%
6TH GRADE
4.1/ 100
METRIC RATING
227th/ 347
METRIC RANK

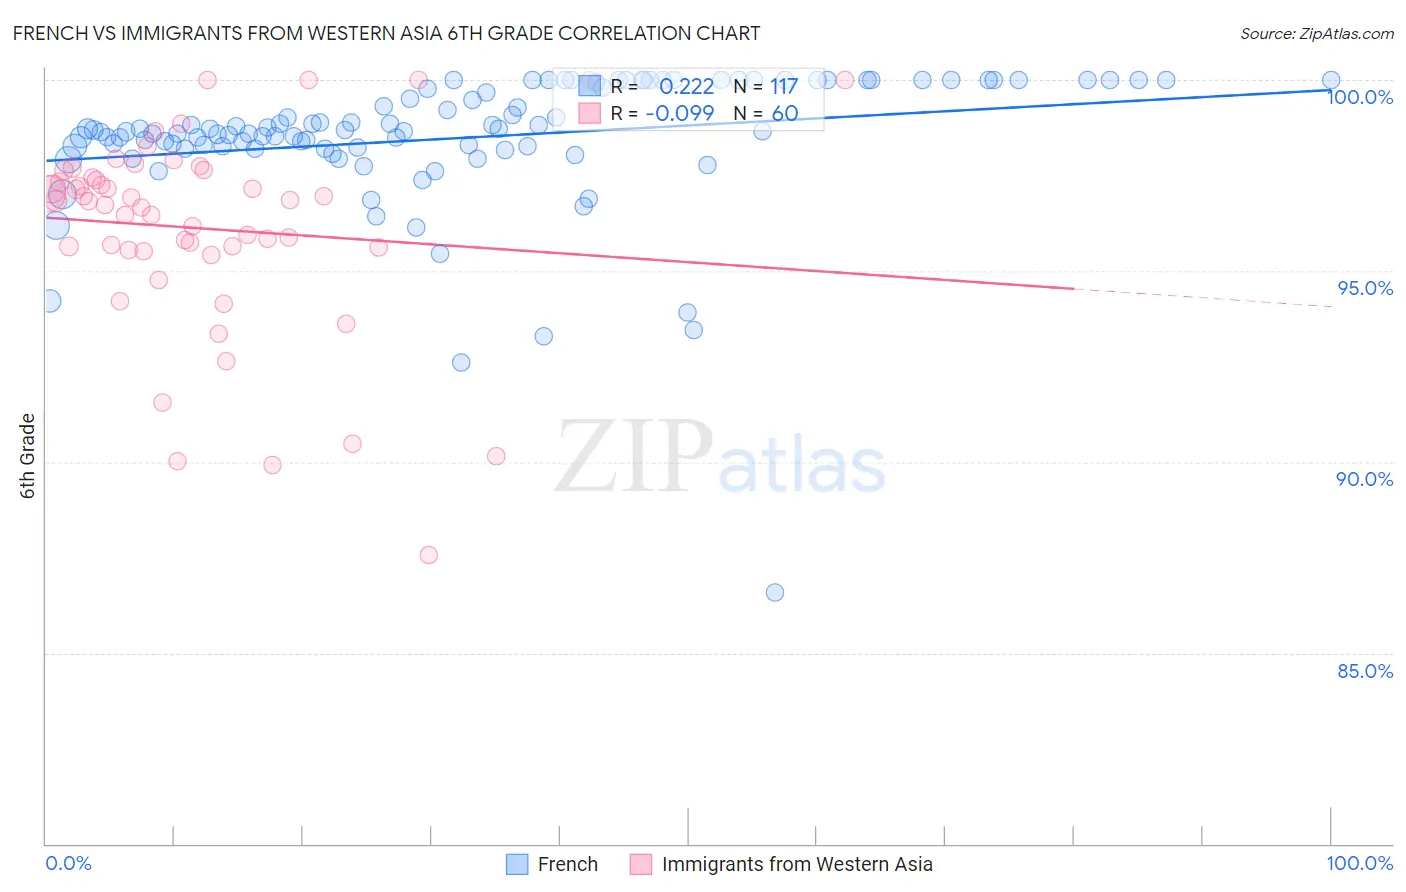
French vs Immigrants from Western Asia 6th Grade Correlation Chart

The statistical analysis conducted on geographies consisting of 572,427,255 people shows a weak positive correlation between the proportion of French and percentage of population with at least 6th grade education in the United States with a correlation coefficient (R) of 0.222 and weighted average of 98.0%. Similarly, the statistical analysis conducted on geographies consisting of 404,389,948 people shows a slight negative correlation between the proportion of Immigrants from Western Asia and percentage of population with at least 6th grade education in the United States with a correlation coefficient (R) of -0.099 and weighted average of 96.7%, a difference of 1.3%.
French vs Immigrants from Western Asia 6th Grade

6th Grade Correlation Summary

MeasurementFrenchImmigrants from Western Asia
Minimum86.6%87.6%
Maximum100.0%100.0%
Range13.4%12.4%
Mean98.5%96.1%
Median98.7%96.8%
Interquartile 25% (IQ1)98.2%95.6%
Interquartile 75% (IQ3)100.0%97.5%
Interquartile Range (IQR)1.8%2.0%
Standard Deviation (Sample)1.8%2.6%
Standard Deviation (Population)1.8%2.6%

Similar Demographics by 6th Grade

Demographics Similar to French by 6th Grade

In terms of 6th grade, the demographic groups most similar to French are Yup'ik (98.0%, a difference of 0.0%), Scandinavian (98.0%, a difference of 0.0%), Czech (98.0%, a difference of 0.010%), French Canadian (98.0%, a difference of 0.010%), and European (98.0%, a difference of 0.010%).
DemographicsRating | Rank6th Grade
Danes
100.0
/100
|
#22
Exceptional
98.0%
Sioux
100.0
/100
|
#23
Exceptional
98.0%
Croatians
100.0
/100
|
#24
Exceptional
98.0%
Scotch-Irish
100.0
/100
|
#25
Exceptional
98.0%
Czechs
100.0
/100
|
#26
Exceptional
98.0%
Yup'ik
100.0
/100
|
#27
Exceptional
98.0%
Scandinavians
100.0
/100
|
#28
Exceptional
98.0%
French
100.0
/100
|
#29
Exceptional
98.0%
French Canadians
100.0
/100
|
#30
Exceptional
98.0%
Europeans
100.0
/100
|
#31
Exceptional
98.0%
Alaska Natives
100.0
/100
|
#32
Exceptional
98.0%
Chippewa
100.0
/100
|
#33
Exceptional
97.9%
Swiss
100.0
/100
|
#34
Exceptional
97.9%
Chinese
100.0
/100
|
#35
Exceptional
97.9%
Italians
100.0
/100
|
#36
Exceptional
97.9%

Demographics Similar to Immigrants from Western Asia by 6th Grade

In terms of 6th grade, the demographic groups most similar to Immigrants from Western Asia are Immigrants from Panama (96.7%, a difference of 0.0%), Immigrants from Malaysia (96.7%, a difference of 0.0%), Assyrian/Chaldean/Syriac (96.7%, a difference of 0.0%), Immigrants from Eastern Asia (96.7%, a difference of 0.0%), and Immigrants from Southern Europe (96.7%, a difference of 0.010%).
DemographicsRating | Rank6th Grade
Immigrants | Morocco
6.2
/100
|
#220
Tragic
96.7%
Tongans
6.1
/100
|
#221
Tragic
96.7%
Immigrants | Syria
5.9
/100
|
#222
Tragic
96.7%
Bahamians
4.8
/100
|
#223
Tragic
96.7%
Immigrants | Southern Europe
4.4
/100
|
#224
Tragic
96.7%
Immigrants | Pakistan
4.4
/100
|
#225
Tragic
96.7%
Immigrants | Panama
4.2
/100
|
#226
Tragic
96.7%
Immigrants | Western Asia
4.1
/100
|
#227
Tragic
96.7%
Immigrants | Malaysia
4.0
/100
|
#228
Tragic
96.7%
Assyrians/Chaldeans/Syriacs
4.0
/100
|
#229
Tragic
96.7%
Immigrants | Eastern Asia
4.0
/100
|
#230
Tragic
96.7%
Sub-Saharan Africans
3.5
/100
|
#231
Tragic
96.7%
South American Indians
3.5
/100
|
#232
Tragic
96.7%
Yuman
3.2
/100
|
#233
Tragic
96.7%
Uruguayans
2.5
/100
|
#234
Tragic
96.6%