Immigrants from Kenya vs Immigrants from Western Asia Family Households
COMPARE
Immigrants from Kenya
Immigrants from Western Asia
Family Households
Family Households Comparison
Immigrants from Kenya
Immigrants from Western Asia
62.3%
FAMILY HOUSEHOLDS
0.0/ 100
METRIC RATING
302nd/ 347
METRIC RANK
64.1%
FAMILY HOUSEHOLDS
25.3/ 100
METRIC RATING
189th/ 347
METRIC RANK
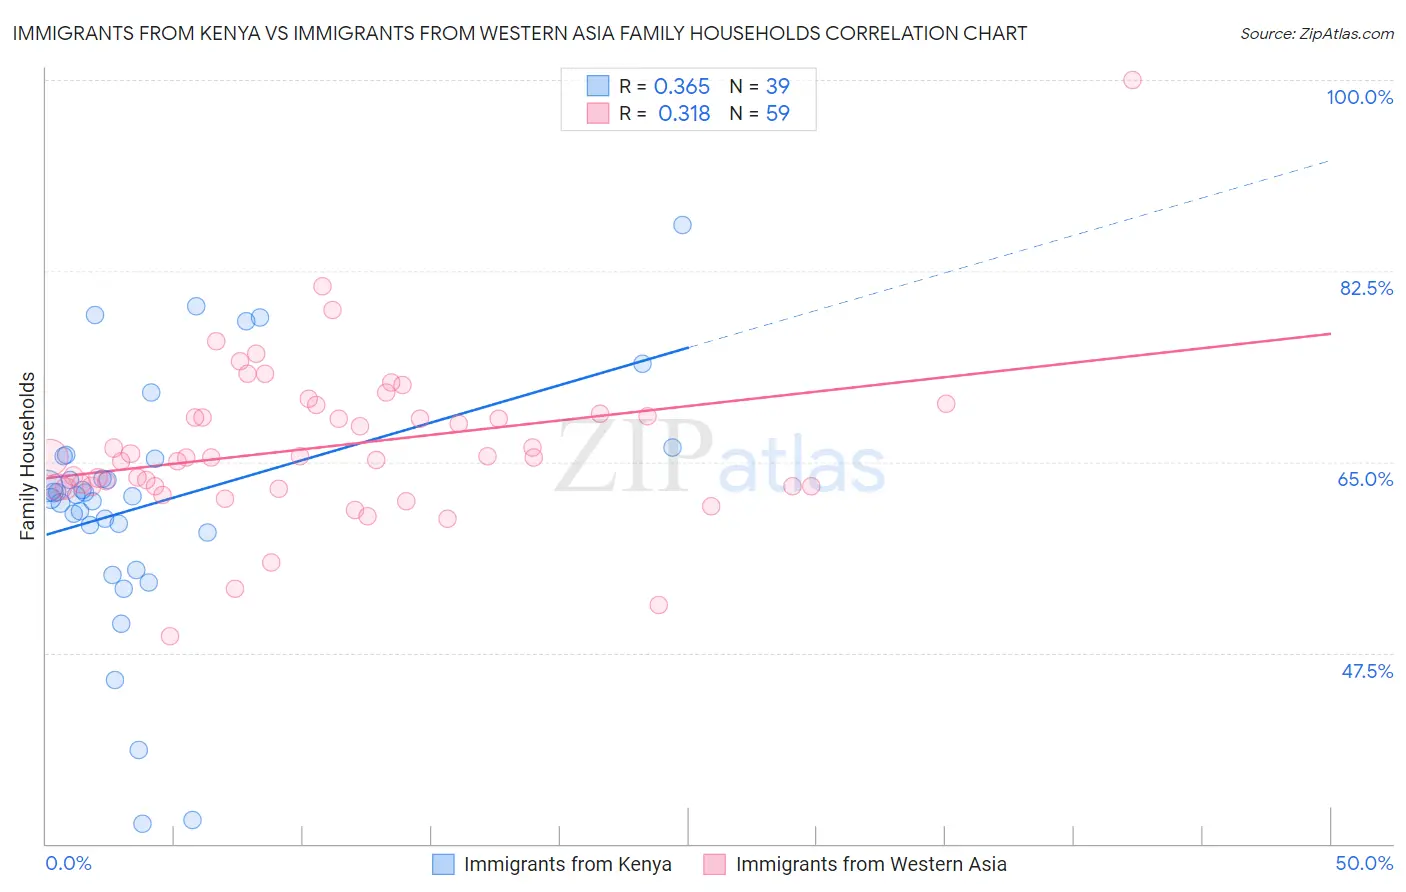
Immigrants from Kenya vs Immigrants from Western Asia Family Households Correlation Chart
The statistical analysis conducted on geographies consisting of 217,999,239 people shows a mild positive correlation between the proportion of Immigrants from Kenya and percentage of family households in the United States with a correlation coefficient (R) of 0.365 and weighted average of 62.3%. Similarly, the statistical analysis conducted on geographies consisting of 404,182,228 people shows a mild positive correlation between the proportion of Immigrants from Western Asia and percentage of family households in the United States with a correlation coefficient (R) of 0.318 and weighted average of 64.1%, a difference of 2.8%.
Family Households Correlation Summary
| Measurement | Immigrants from Kenya | Immigrants from Western Asia |
| Minimum | 31.8% | 49.0% |
| Maximum | 86.7% | 100.0% |
| Range | 54.9% | 51.0% |
| Mean | 61.3% | 66.5% |
| Median | 62.0% | 65.4% |
| Interquartile 25% (IQ1) | 58.5% | 62.8% |
| Interquartile 75% (IQ3) | 65.5% | 69.5% |
| Interquartile Range (IQR) | 7.0% | 6.7% |
| Standard Deviation (Sample) | 11.5% | 7.4% |
| Standard Deviation (Population) | 11.4% | 7.4% |
Similar Demographics by Family Households
Demographics Similar to Immigrants from Kenya by Family Households
In terms of family households, the demographic groups most similar to Immigrants from Kenya are Immigrants from Albania (62.4%, a difference of 0.040%), Immigrants from Africa (62.4%, a difference of 0.060%), Cree (62.3%, a difference of 0.060%), Immigrants from Kuwait (62.4%, a difference of 0.070%), and Immigrants from Spain (62.4%, a difference of 0.13%).
| Demographics | Rating | Rank | Family Households |
| Okinawans | 0.0 /100 | #295 | Tragic 62.5% |
| Slovenes | 0.0 /100 | #296 | Tragic 62.4% |
| French American Indians | 0.0 /100 | #297 | Tragic 62.4% |
| Immigrants | Spain | 0.0 /100 | #298 | Tragic 62.4% |
| Immigrants | Kuwait | 0.0 /100 | #299 | Tragic 62.4% |
| Immigrants | Africa | 0.0 /100 | #300 | Tragic 62.4% |
| Immigrants | Albania | 0.0 /100 | #301 | Tragic 62.4% |
| Immigrants | Kenya | 0.0 /100 | #302 | Tragic 62.3% |
| Cree | 0.0 /100 | #303 | Tragic 62.3% |
| Iroquois | 0.0 /100 | #304 | Tragic 62.2% |
| Bermudans | 0.0 /100 | #305 | Tragic 62.2% |
| Africans | 0.0 /100 | #306 | Tragic 62.1% |
| Immigrants | Norway | 0.0 /100 | #307 | Tragic 62.1% |
| Chippewa | 0.0 /100 | #308 | Tragic 62.1% |
| Sub-Saharan Africans | 0.0 /100 | #309 | Tragic 62.1% |
Demographics Similar to Immigrants from Western Asia by Family Households
In terms of family households, the demographic groups most similar to Immigrants from Western Asia are Zimbabwean (64.1%, a difference of 0.010%), Paraguayan (64.1%, a difference of 0.020%), Arab (64.1%, a difference of 0.020%), Lithuanian (64.0%, a difference of 0.030%), and French (64.0%, a difference of 0.030%).
| Demographics | Rating | Rank | Family Households |
| Ukrainians | 34.6 /100 | #182 | Fair 64.2% |
| Creek | 34.1 /100 | #183 | Fair 64.2% |
| Puerto Ricans | 33.4 /100 | #184 | Fair 64.2% |
| Immigrants | Iran | 30.4 /100 | #185 | Fair 64.1% |
| Spanish Americans | 30.1 /100 | #186 | Fair 64.1% |
| Northern Europeans | 28.2 /100 | #187 | Fair 64.1% |
| Paraguayans | 26.7 /100 | #188 | Fair 64.1% |
| Immigrants | Western Asia | 25.3 /100 | #189 | Fair 64.1% |
| Zimbabweans | 24.7 /100 | #190 | Fair 64.1% |
| Arabs | 24.5 /100 | #191 | Fair 64.1% |
| Lithuanians | 23.8 /100 | #192 | Fair 64.0% |
| French | 23.7 /100 | #193 | Fair 64.0% |
| Paiute | 22.2 /100 | #194 | Fair 64.0% |
| Immigrants | North America | 20.0 /100 | #195 | Poor 64.0% |
| Immigrants | Canada | 19.2 /100 | #196 | Poor 64.0% |