Immigrants from Lithuania vs Yakama Associate's Degree
COMPARE
Immigrants from Lithuania
Yakama
Associate's Degree
Associate's Degree Comparison
Immigrants from Lithuania
Yakama
52.4%
ASSOCIATE'S DEGREE
99.9/ 100
METRIC RATING
45th/ 347
METRIC RANK
32.3%
ASSOCIATE'S DEGREE
0.0/ 100
METRIC RATING
342nd/ 347
METRIC RANK
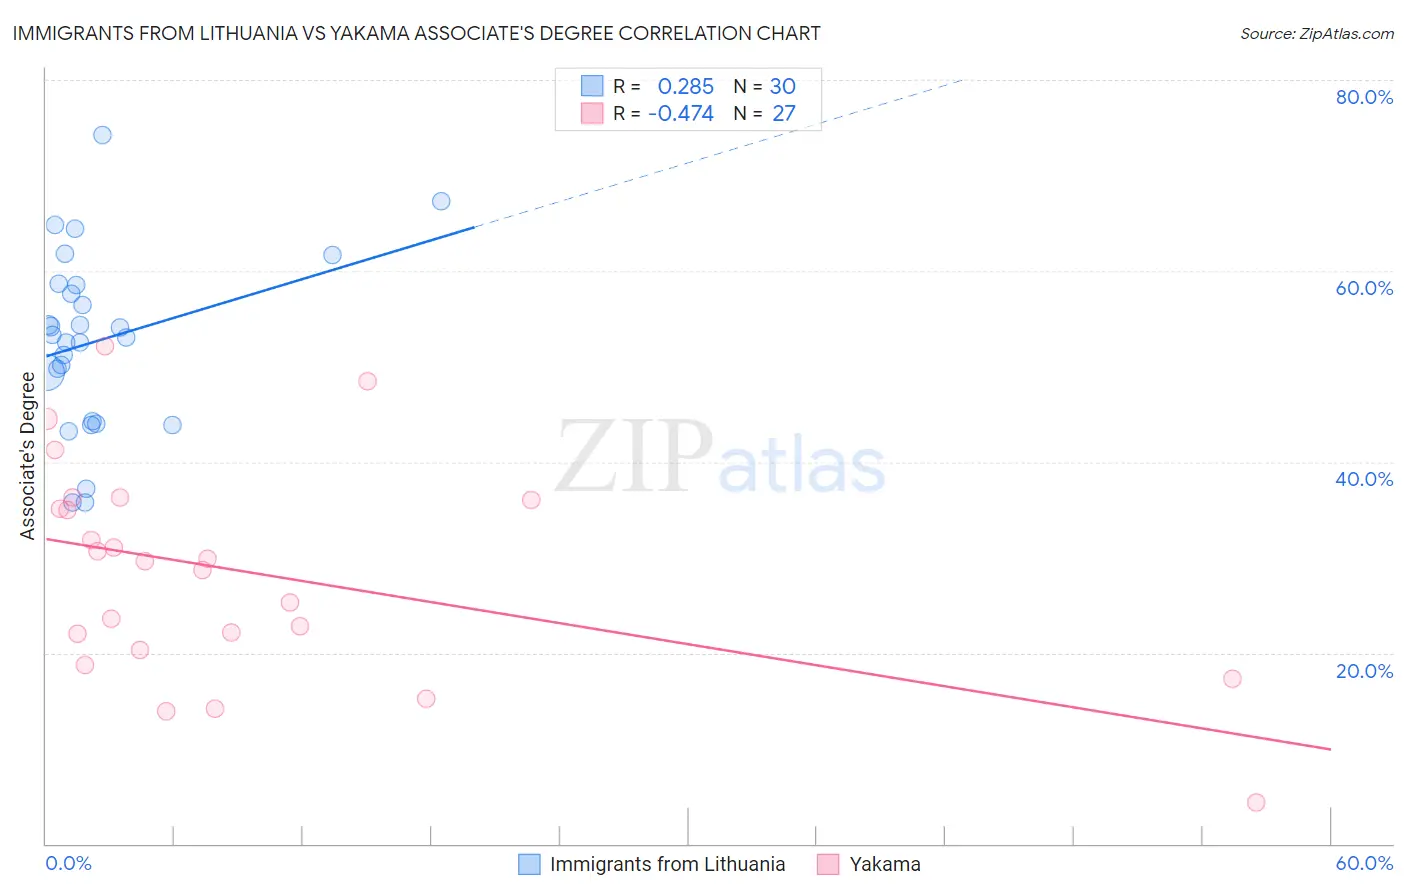
Immigrants from Lithuania vs Yakama Associate's Degree Correlation Chart
The statistical analysis conducted on geographies consisting of 117,722,731 people shows a weak positive correlation between the proportion of Immigrants from Lithuania and percentage of population with at least associate's degree education in the United States with a correlation coefficient (R) of 0.285 and weighted average of 52.4%. Similarly, the statistical analysis conducted on geographies consisting of 19,923,144 people shows a moderate negative correlation between the proportion of Yakama and percentage of population with at least associate's degree education in the United States with a correlation coefficient (R) of -0.474 and weighted average of 32.3%, a difference of 62.3%.
Associate's Degree Correlation Summary
| Measurement | Immigrants from Lithuania | Yakama |
| Minimum | 35.7% | 4.3% |
| Maximum | 74.3% | 52.0% |
| Range | 38.5% | 47.8% |
| Mean | 52.7% | 28.4% |
| Median | 53.2% | 29.5% |
| Interquartile 25% (IQ1) | 44.2% | 20.3% |
| Interquartile 75% (IQ3) | 58.5% | 36.0% |
| Interquartile Range (IQR) | 14.3% | 15.7% |
| Standard Deviation (Sample) | 9.2% | 11.2% |
| Standard Deviation (Population) | 9.1% | 11.0% |
Similar Demographics by Associate's Degree
Demographics Similar to Immigrants from Lithuania by Associate's Degree
In terms of associate's degree, the demographic groups most similar to Immigrants from Lithuania are Estonian (52.5%, a difference of 0.080%), Immigrants from Bulgaria (52.4%, a difference of 0.13%), Immigrants from Kuwait (52.4%, a difference of 0.14%), Immigrants from South Africa (52.5%, a difference of 0.16%), and Immigrants from Malaysia (52.5%, a difference of 0.17%).
| Demographics | Rating | Rank | Associate's Degree |
| Mongolians | 100.0 /100 | #38 | Exceptional 53.0% |
| Immigrants | Belarus | 99.9 /100 | #39 | Exceptional 52.8% |
| Immigrants | Latvia | 99.9 /100 | #40 | Exceptional 52.8% |
| Immigrants | Saudi Arabia | 99.9 /100 | #41 | Exceptional 52.6% |
| Immigrants | Malaysia | 99.9 /100 | #42 | Exceptional 52.5% |
| Immigrants | South Africa | 99.9 /100 | #43 | Exceptional 52.5% |
| Estonians | 99.9 /100 | #44 | Exceptional 52.5% |
| Immigrants | Lithuania | 99.9 /100 | #45 | Exceptional 52.4% |
| Immigrants | Bulgaria | 99.9 /100 | #46 | Exceptional 52.4% |
| Immigrants | Kuwait | 99.9 /100 | #47 | Exceptional 52.4% |
| Immigrants | Norway | 99.9 /100 | #48 | Exceptional 52.2% |
| Immigrants | Austria | 99.9 /100 | #49 | Exceptional 52.1% |
| Asians | 99.9 /100 | #50 | Exceptional 52.1% |
| Immigrants | Greece | 99.9 /100 | #51 | Exceptional 52.1% |
| Bolivians | 99.8 /100 | #52 | Exceptional 52.0% |
Demographics Similar to Yakama by Associate's Degree
In terms of associate's degree, the demographic groups most similar to Yakama are Inupiat (32.6%, a difference of 0.77%), Navajo (32.6%, a difference of 0.83%), Tohono O'odham (31.8%, a difference of 1.7%), Yuman (31.3%, a difference of 3.4%), and Immigrants from Mexico (33.7%, a difference of 4.4%).
| Demographics | Rating | Rank | Associate's Degree |
| Mexicans | 0.0 /100 | #333 | Tragic 35.0% |
| Natives/Alaskans | 0.0 /100 | #334 | Tragic 34.9% |
| Spanish American Indians | 0.0 /100 | #335 | Tragic 34.9% |
| Hopi | 0.0 /100 | #336 | Tragic 34.6% |
| Lumbee | 0.0 /100 | #337 | Tragic 34.1% |
| Pueblo | 0.0 /100 | #338 | Tragic 34.0% |
| Immigrants | Mexico | 0.0 /100 | #339 | Tragic 33.7% |
| Navajo | 0.0 /100 | #340 | Tragic 32.6% |
| Inupiat | 0.0 /100 | #341 | Tragic 32.6% |
| Yakama | 0.0 /100 | #342 | Tragic 32.3% |
| Tohono O'odham | 0.0 /100 | #343 | Tragic 31.8% |
| Yuman | 0.0 /100 | #344 | Tragic 31.3% |
| Pima | 0.0 /100 | #345 | Tragic 30.2% |
| Houma | 0.0 /100 | #346 | Tragic 28.2% |
| Yup'ik | 0.0 /100 | #347 | Tragic 25.0% |