Immigrants from South Eastern Asia vs Yakama Associate's Degree
COMPARE
Immigrants from South Eastern Asia
Yakama
Associate's Degree
Associate's Degree Comparison
Immigrants from South Eastern Asia
Yakama
45.2%
ASSOCIATE'S DEGREE
20.2/ 100
METRIC RATING
203rd/ 347
METRIC RANK
32.3%
ASSOCIATE'S DEGREE
0.0/ 100
METRIC RATING
342nd/ 347
METRIC RANK
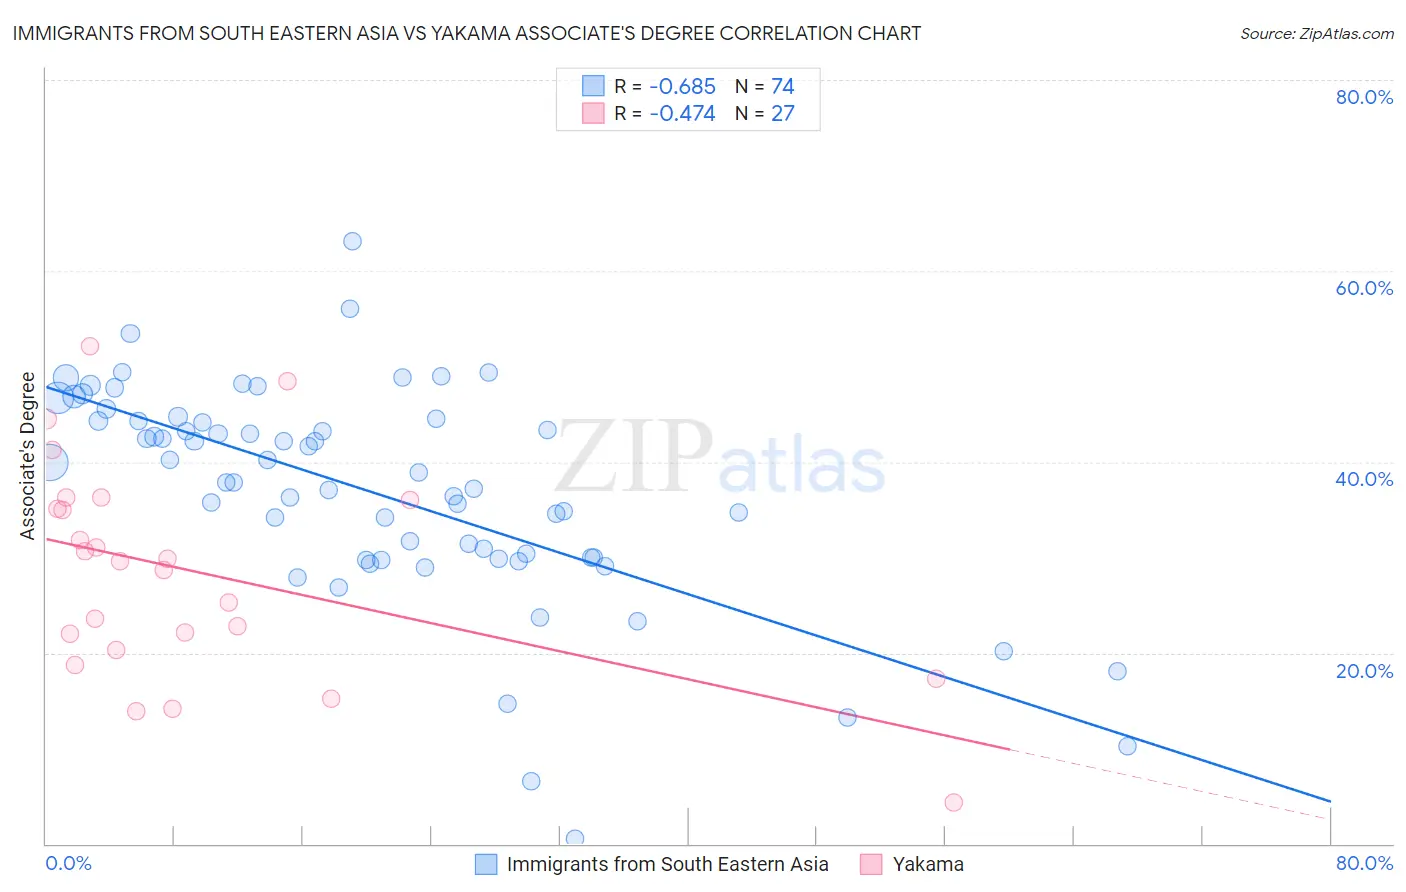
Immigrants from South Eastern Asia vs Yakama Associate's Degree Correlation Chart
The statistical analysis conducted on geographies consisting of 512,661,468 people shows a significant negative correlation between the proportion of Immigrants from South Eastern Asia and percentage of population with at least associate's degree education in the United States with a correlation coefficient (R) of -0.685 and weighted average of 45.2%. Similarly, the statistical analysis conducted on geographies consisting of 19,923,144 people shows a moderate negative correlation between the proportion of Yakama and percentage of population with at least associate's degree education in the United States with a correlation coefficient (R) of -0.474 and weighted average of 32.3%, a difference of 39.8%.
Associate's Degree Correlation Summary
| Measurement | Immigrants from South Eastern Asia | Yakama |
| Minimum | 0.50% | 4.3% |
| Maximum | 63.1% | 52.0% |
| Range | 62.6% | 47.8% |
| Mean | 36.9% | 28.4% |
| Median | 38.4% | 29.5% |
| Interquartile 25% (IQ1) | 29.9% | 20.3% |
| Interquartile 75% (IQ3) | 44.3% | 36.0% |
| Interquartile Range (IQR) | 14.4% | 15.7% |
| Standard Deviation (Sample) | 11.4% | 11.2% |
| Standard Deviation (Population) | 11.3% | 11.0% |
Similar Demographics by Associate's Degree
Demographics Similar to Immigrants from South Eastern Asia by Associate's Degree
In terms of associate's degree, the demographic groups most similar to Immigrants from South Eastern Asia are Spaniard (45.2%, a difference of 0.020%), Immigrants from Vietnam (45.2%, a difference of 0.070%), Senegalese (45.2%, a difference of 0.10%), Immigrants from Senegal (45.2%, a difference of 0.11%), and Immigrants from Bangladesh (45.2%, a difference of 0.13%).
| Demographics | Rating | Rank | Associate's Degree |
| French | 25.6 /100 | #196 | Fair 45.4% |
| Scotch-Irish | 22.3 /100 | #197 | Fair 45.3% |
| Immigrants | Bangladesh | 21.3 /100 | #198 | Fair 45.2% |
| Immigrants | Senegal | 21.2 /100 | #199 | Fair 45.2% |
| Senegalese | 21.1 /100 | #200 | Fair 45.2% |
| Immigrants | Vietnam | 20.8 /100 | #201 | Fair 45.2% |
| Spaniards | 20.4 /100 | #202 | Fair 45.2% |
| Immigrants | South Eastern Asia | 20.2 /100 | #203 | Fair 45.2% |
| Nigerians | 19.1 /100 | #204 | Poor 45.1% |
| Immigrants | Thailand | 18.9 /100 | #205 | Poor 45.1% |
| German Russians | 18.9 /100 | #206 | Poor 45.1% |
| Panamanians | 18.4 /100 | #207 | Poor 45.1% |
| Dutch | 17.6 /100 | #208 | Poor 45.0% |
| Immigrants | Costa Rica | 16.7 /100 | #209 | Poor 45.0% |
| Immigrants | Philippines | 16.7 /100 | #210 | Poor 45.0% |
Demographics Similar to Yakama by Associate's Degree
In terms of associate's degree, the demographic groups most similar to Yakama are Inupiat (32.6%, a difference of 0.77%), Navajo (32.6%, a difference of 0.83%), Tohono O'odham (31.8%, a difference of 1.7%), Yuman (31.3%, a difference of 3.4%), and Immigrants from Mexico (33.7%, a difference of 4.4%).
| Demographics | Rating | Rank | Associate's Degree |
| Mexicans | 0.0 /100 | #333 | Tragic 35.0% |
| Natives/Alaskans | 0.0 /100 | #334 | Tragic 34.9% |
| Spanish American Indians | 0.0 /100 | #335 | Tragic 34.9% |
| Hopi | 0.0 /100 | #336 | Tragic 34.6% |
| Lumbee | 0.0 /100 | #337 | Tragic 34.1% |
| Pueblo | 0.0 /100 | #338 | Tragic 34.0% |
| Immigrants | Mexico | 0.0 /100 | #339 | Tragic 33.7% |
| Navajo | 0.0 /100 | #340 | Tragic 32.6% |
| Inupiat | 0.0 /100 | #341 | Tragic 32.6% |
| Yakama | 0.0 /100 | #342 | Tragic 32.3% |
| Tohono O'odham | 0.0 /100 | #343 | Tragic 31.8% |
| Yuman | 0.0 /100 | #344 | Tragic 31.3% |
| Pima | 0.0 /100 | #345 | Tragic 30.2% |
| Houma | 0.0 /100 | #346 | Tragic 28.2% |
| Yup'ik | 0.0 /100 | #347 | Tragic 25.0% |