Immigrants from Kazakhstan vs Ecuadorian 2nd Grade
COMPARE
Immigrants from Kazakhstan
Ecuadorian
2nd Grade
2nd Grade Comparison
Immigrants from Kazakhstan
Ecuadorians
97.8%
2ND GRADE
35.6/ 100
METRIC RATING
188th/ 347
METRIC RANK
96.9%
2ND GRADE
0.0/ 100
METRIC RATING
303rd/ 347
METRIC RANK
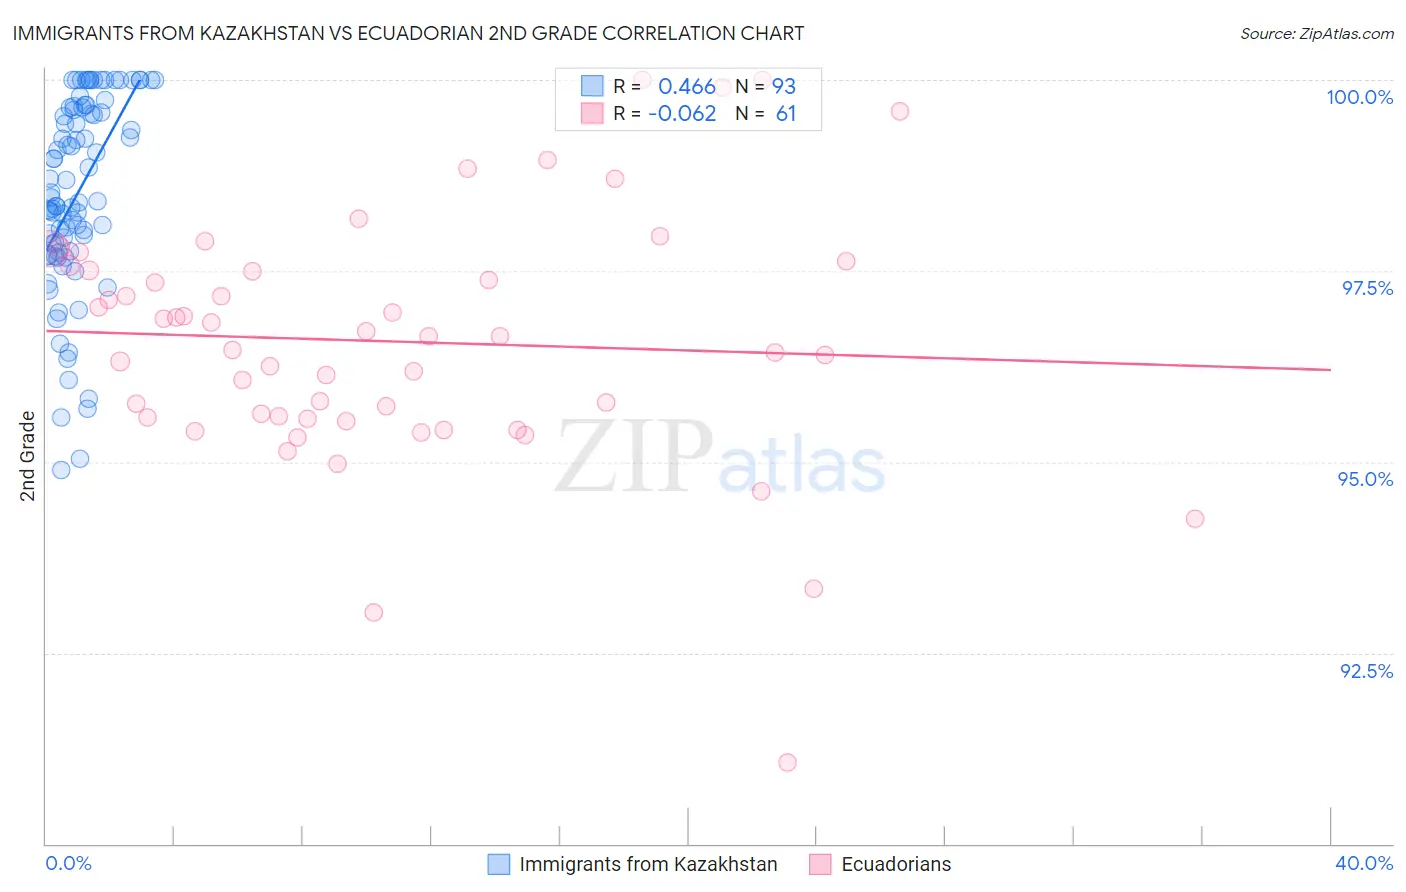
Immigrants from Kazakhstan vs Ecuadorian 2nd Grade Correlation Chart
The statistical analysis conducted on geographies consisting of 124,444,388 people shows a moderate positive correlation between the proportion of Immigrants from Kazakhstan and percentage of population with at least 2nd grade education in the United States with a correlation coefficient (R) of 0.466 and weighted average of 97.8%. Similarly, the statistical analysis conducted on geographies consisting of 317,865,723 people shows a slight negative correlation between the proportion of Ecuadorians and percentage of population with at least 2nd grade education in the United States with a correlation coefficient (R) of -0.062 and weighted average of 96.9%, a difference of 0.94%.
2nd Grade Correlation Summary
| Measurement | Immigrants from Kazakhstan | Ecuadorian |
| Minimum | 94.9% | 91.1% |
| Maximum | 100.0% | 100.0% |
| Range | 5.1% | 8.9% |
| Mean | 98.5% | 96.6% |
| Median | 98.5% | 96.6% |
| Interquartile 25% (IQ1) | 97.8% | 95.6% |
| Interquartile 75% (IQ3) | 99.6% | 97.5% |
| Interquartile Range (IQR) | 1.9% | 2.0% |
| Standard Deviation (Sample) | 1.3% | 1.6% |
| Standard Deviation (Population) | 1.3% | 1.6% |
Similar Demographics by 2nd Grade
Demographics Similar to Immigrants from Kazakhstan by 2nd Grade
In terms of 2nd grade, the demographic groups most similar to Immigrants from Kazakhstan are Arab (97.8%, a difference of 0.0%), Pakistani (97.8%, a difference of 0.0%), Panamanian (97.8%, a difference of 0.010%), Immigrants from Taiwan (97.8%, a difference of 0.010%), and Portuguese (97.8%, a difference of 0.020%).
| Demographics | Rating | Rank | 2nd Grade |
| Egyptians | 44.3 /100 | #181 | Average 97.9% |
| Portuguese | 42.4 /100 | #182 | Average 97.8% |
| Immigrants | Poland | 42.2 /100 | #183 | Average 97.8% |
| Immigrants | Belarus | 41.5 /100 | #184 | Average 97.8% |
| Immigrants | Argentina | 40.6 /100 | #185 | Average 97.8% |
| Arabs | 36.9 /100 | #186 | Fair 97.8% |
| Pakistanis | 36.1 /100 | #187 | Fair 97.8% |
| Immigrants | Kazakhstan | 35.6 /100 | #188 | Fair 97.8% |
| Panamanians | 33.5 /100 | #189 | Fair 97.8% |
| Immigrants | Taiwan | 31.8 /100 | #190 | Fair 97.8% |
| Paraguayans | 30.8 /100 | #191 | Fair 97.8% |
| Blacks/African Americans | 29.9 /100 | #192 | Fair 97.8% |
| Hawaiians | 28.5 /100 | #193 | Fair 97.8% |
| Paiute | 27.0 /100 | #194 | Fair 97.8% |
| Mongolians | 26.7 /100 | #195 | Fair 97.8% |
Demographics Similar to Ecuadorians by 2nd Grade
In terms of 2nd grade, the demographic groups most similar to Ecuadorians are Immigrants from Caribbean (96.9%, a difference of 0.0%), Nicaraguan (96.9%, a difference of 0.020%), Somali (97.0%, a difference of 0.040%), Immigrants from Somalia (96.9%, a difference of 0.040%), and Central American Indian (97.0%, a difference of 0.060%).
| Demographics | Rating | Rank | 2nd Grade |
| Immigrants | Immigrants | 0.0 /100 | #296 | Tragic 97.1% |
| Immigrants | Cuba | 0.0 /100 | #297 | Tragic 97.0% |
| Immigrants | Dominica | 0.0 /100 | #298 | Tragic 97.0% |
| Haitians | 0.0 /100 | #299 | Tragic 97.0% |
| Immigrants | South Eastern Asia | 0.0 /100 | #300 | Tragic 97.0% |
| Central American Indians | 0.0 /100 | #301 | Tragic 97.0% |
| Somalis | 0.0 /100 | #302 | Tragic 97.0% |
| Ecuadorians | 0.0 /100 | #303 | Tragic 96.9% |
| Immigrants | Caribbean | 0.0 /100 | #304 | Tragic 96.9% |
| Nicaraguans | 0.0 /100 | #305 | Tragic 96.9% |
| Immigrants | Somalia | 0.0 /100 | #306 | Tragic 96.9% |
| Immigrants | Azores | 0.0 /100 | #307 | Tragic 96.8% |
| Immigrants | Haiti | 0.0 /100 | #308 | Tragic 96.8% |
| Belizeans | 0.0 /100 | #309 | Tragic 96.8% |
| Sri Lankans | 0.0 /100 | #310 | Tragic 96.8% |