Immigrants from Kazakhstan vs Immigrants from Kenya Nursery School
COMPARE
Immigrants from Kazakhstan
Immigrants from Kenya
Nursery School
Nursery School Comparison
Immigrants from Kazakhstan
Immigrants from Kenya
97.9%
NURSERY SCHOOL
37.1/ 100
METRIC RATING
187th/ 347
METRIC RANK
97.9%
NURSERY SCHOOL
24.1/ 100
METRIC RATING
198th/ 347
METRIC RANK
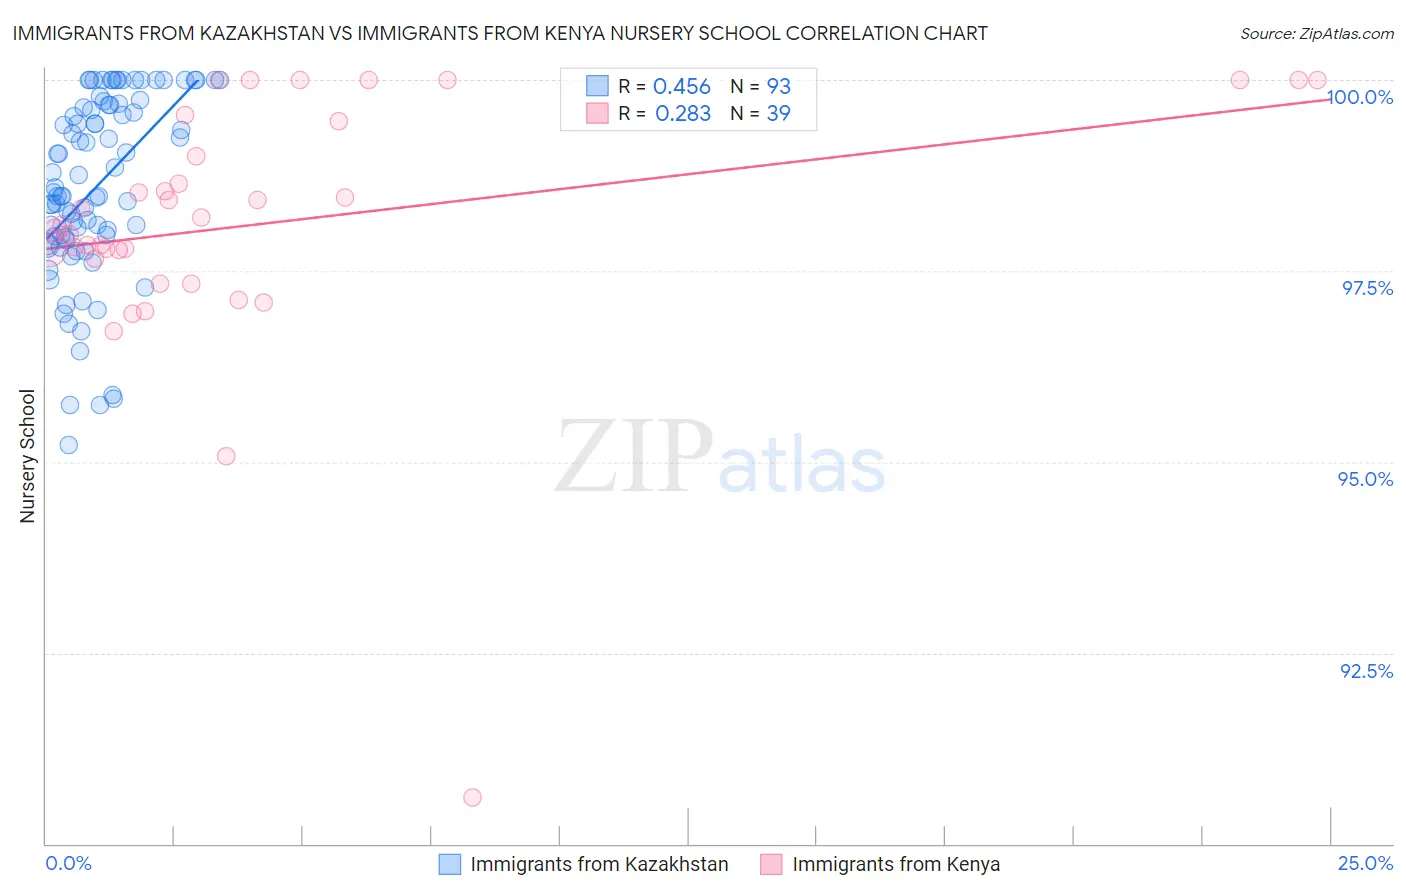
Immigrants from Kazakhstan vs Immigrants from Kenya Nursery School Correlation Chart
The statistical analysis conducted on geographies consisting of 124,444,388 people shows a moderate positive correlation between the proportion of Immigrants from Kazakhstan and percentage of population with at least nursery school education in the United States with a correlation coefficient (R) of 0.456 and weighted average of 97.9%. Similarly, the statistical analysis conducted on geographies consisting of 218,076,690 people shows a weak positive correlation between the proportion of Immigrants from Kenya and percentage of population with at least nursery school education in the United States with a correlation coefficient (R) of 0.283 and weighted average of 97.9%, a difference of 0.050%.
Nursery School Correlation Summary
| Measurement | Immigrants from Kazakhstan | Immigrants from Kenya |
| Minimum | 95.2% | 90.6% |
| Maximum | 100.0% | 100.0% |
| Range | 4.8% | 9.4% |
| Mean | 98.6% | 98.1% |
| Median | 98.5% | 98.1% |
| Interquartile 25% (IQ1) | 97.9% | 97.7% |
| Interquartile 75% (IQ3) | 99.7% | 99.5% |
| Interquartile Range (IQR) | 1.7% | 1.8% |
| Standard Deviation (Sample) | 1.2% | 1.7% |
| Standard Deviation (Population) | 1.2% | 1.7% |
Demographics Similar to Immigrants from Kazakhstan and Immigrants from Kenya by Nursery School
In terms of nursery school, the demographic groups most similar to Immigrants from Kazakhstan are Portuguese (98.0%, a difference of 0.010%), Immigrants from Poland (98.0%, a difference of 0.010%), Immigrants from Belarus (98.0%, a difference of 0.010%), Immigrants from Argentina (98.0%, a difference of 0.010%), and Arab (97.9%, a difference of 0.010%). Similarly, the demographic groups most similar to Immigrants from Kenya are Paraguayan (97.9%, a difference of 0.010%), Mongolian (97.9%, a difference of 0.010%), Hawaiian (97.9%, a difference of 0.010%), Guamanian/Chamorro (97.9%, a difference of 0.010%), and Yuman (97.9%, a difference of 0.010%).
| Demographics | Rating | Rank | Nursery School |
| Paiute | 42.0 /100 | #182 | Average 98.0% |
| Portuguese | 41.8 /100 | #183 | Average 98.0% |
| Immigrants | Poland | 41.3 /100 | #184 | Average 98.0% |
| Immigrants | Belarus | 41.0 /100 | #185 | Average 98.0% |
| Immigrants | Argentina | 40.8 /100 | #186 | Average 98.0% |
| Immigrants | Kazakhstan | 37.1 /100 | #187 | Fair 97.9% |
| Arabs | 34.7 /100 | #188 | Fair 97.9% |
| Pakistanis | 34.6 /100 | #189 | Fair 97.9% |
| Panamanians | 34.3 /100 | #190 | Fair 97.9% |
| Immigrants | Taiwan | 30.6 /100 | #191 | Fair 97.9% |
| Blacks/African Americans | 29.4 /100 | #192 | Fair 97.9% |
| Paraguayans | 27.4 /100 | #193 | Fair 97.9% |
| Mongolians | 27.3 /100 | #194 | Fair 97.9% |
| Hawaiians | 27.2 /100 | #195 | Fair 97.9% |
| Guamanians/Chamorros | 25.7 /100 | #196 | Fair 97.9% |
| Yuman | 25.7 /100 | #197 | Fair 97.9% |
| Immigrants | Kenya | 24.1 /100 | #198 | Fair 97.9% |
| Immigrants | Egypt | 22.5 /100 | #199 | Fair 97.9% |
| Tohono O'odham | 22.2 /100 | #200 | Fair 97.9% |
| Immigrants | Lebanon | 21.2 /100 | #201 | Fair 97.9% |
| Immigrants | Ukraine | 19.9 /100 | #202 | Poor 97.9% |