Cheyenne vs Immigrants from Kenya Nursery School
COMPARE
Cheyenne
Immigrants from Kenya
Nursery School
Nursery School Comparison
Cheyenne
Immigrants from Kenya
98.4%
NURSERY SCHOOL
99.6/ 100
METRIC RATING
70th/ 347
METRIC RANK
97.9%
NURSERY SCHOOL
24.1/ 100
METRIC RATING
198th/ 347
METRIC RANK
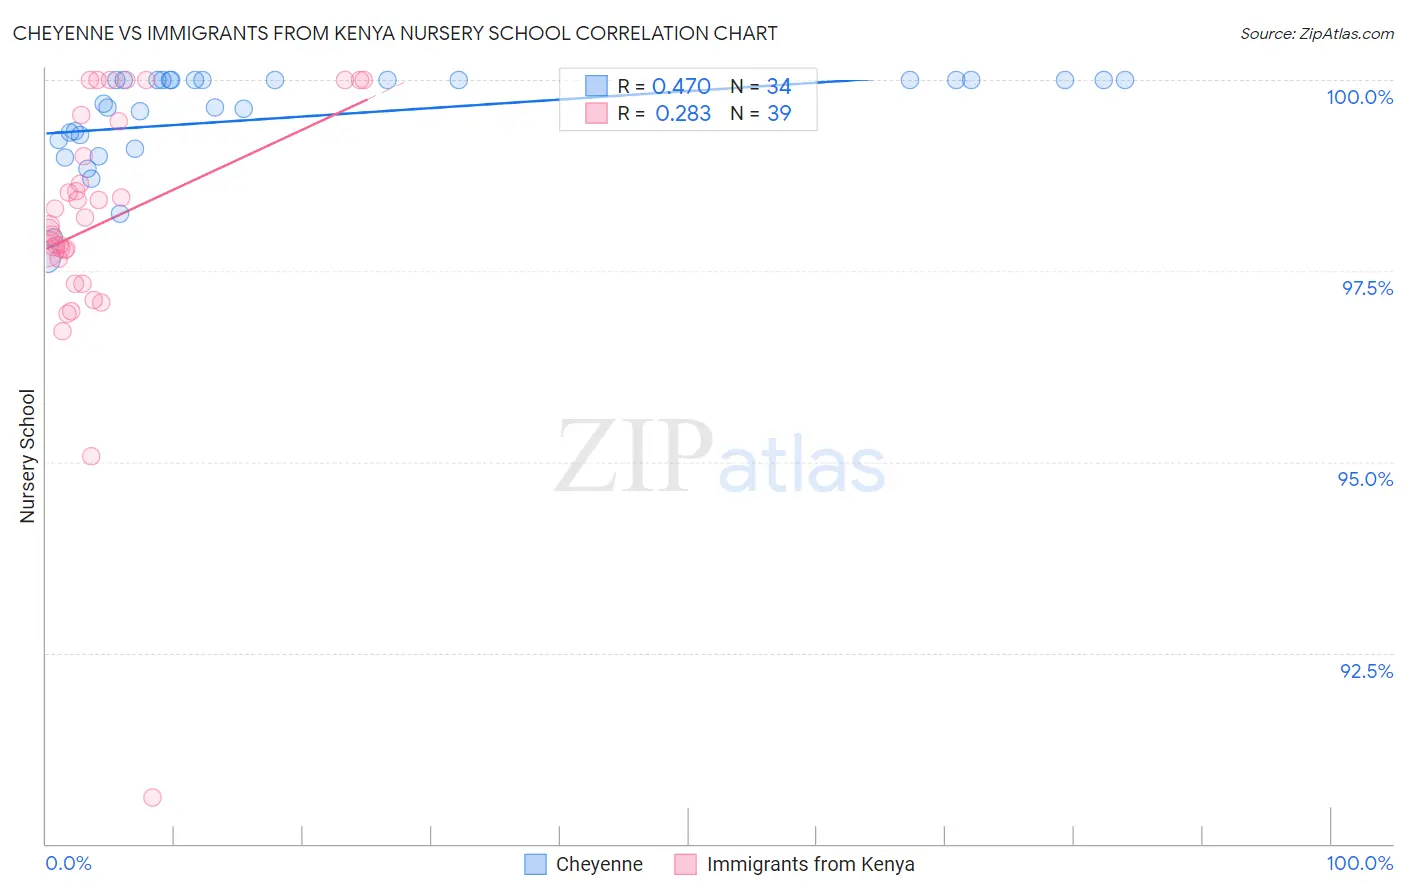
Cheyenne vs Immigrants from Kenya Nursery School Correlation Chart
The statistical analysis conducted on geographies consisting of 80,719,411 people shows a moderate positive correlation between the proportion of Cheyenne and percentage of population with at least nursery school education in the United States with a correlation coefficient (R) of 0.470 and weighted average of 98.4%. Similarly, the statistical analysis conducted on geographies consisting of 218,076,690 people shows a weak positive correlation between the proportion of Immigrants from Kenya and percentage of population with at least nursery school education in the United States with a correlation coefficient (R) of 0.283 and weighted average of 97.9%, a difference of 0.51%.
Nursery School Correlation Summary
| Measurement | Cheyenne | Immigrants from Kenya |
| Minimum | 97.7% | 90.6% |
| Maximum | 100.0% | 100.0% |
| Range | 2.3% | 9.4% |
| Mean | 99.5% | 98.1% |
| Median | 99.8% | 98.1% |
| Interquartile 25% (IQ1) | 99.2% | 97.7% |
| Interquartile 75% (IQ3) | 100.0% | 99.5% |
| Interquartile Range (IQR) | 0.79% | 1.8% |
| Standard Deviation (Sample) | 0.64% | 1.7% |
| Standard Deviation (Population) | 0.63% | 1.7% |
Similar Demographics by Nursery School
Demographics Similar to Cheyenne by Nursery School
In terms of nursery school, the demographic groups most similar to Cheyenne are Immigrants from Northern Europe (98.4%, a difference of 0.0%), Russian (98.4%, a difference of 0.0%), Immigrants from Austria (98.4%, a difference of 0.0%), Serbian (98.4%, a difference of 0.0%), and Canadian (98.4%, a difference of 0.010%).
| Demographics | Rating | Rank | Nursery School |
| Immigrants | North America | 99.7 /100 | #63 | Exceptional 98.4% |
| Greeks | 99.7 /100 | #64 | Exceptional 98.4% |
| Maltese | 99.7 /100 | #65 | Exceptional 98.4% |
| Canadians | 99.7 /100 | #66 | Exceptional 98.4% |
| Immigrants | Northern Europe | 99.6 /100 | #67 | Exceptional 98.4% |
| Russians | 99.6 /100 | #68 | Exceptional 98.4% |
| Immigrants | Austria | 99.6 /100 | #69 | Exceptional 98.4% |
| Cheyenne | 99.6 /100 | #70 | Exceptional 98.4% |
| Serbians | 99.6 /100 | #71 | Exceptional 98.4% |
| Chickasaw | 99.6 /100 | #72 | Exceptional 98.4% |
| Cajuns | 99.4 /100 | #73 | Exceptional 98.4% |
| Immigrants | Netherlands | 99.4 /100 | #74 | Exceptional 98.4% |
| Cherokee | 99.3 /100 | #75 | Exceptional 98.3% |
| Immigrants | England | 99.3 /100 | #76 | Exceptional 98.3% |
| Immigrants | Lithuania | 99.3 /100 | #77 | Exceptional 98.3% |
Demographics Similar to Immigrants from Kenya by Nursery School
In terms of nursery school, the demographic groups most similar to Immigrants from Kenya are Paraguayan (97.9%, a difference of 0.010%), Mongolian (97.9%, a difference of 0.010%), Hawaiian (97.9%, a difference of 0.010%), Guamanian/Chamorro (97.9%, a difference of 0.010%), and Yuman (97.9%, a difference of 0.010%).
| Demographics | Rating | Rank | Nursery School |
| Immigrants | Taiwan | 30.6 /100 | #191 | Fair 97.9% |
| Blacks/African Americans | 29.4 /100 | #192 | Fair 97.9% |
| Paraguayans | 27.4 /100 | #193 | Fair 97.9% |
| Mongolians | 27.3 /100 | #194 | Fair 97.9% |
| Hawaiians | 27.2 /100 | #195 | Fair 97.9% |
| Guamanians/Chamorros | 25.7 /100 | #196 | Fair 97.9% |
| Yuman | 25.7 /100 | #197 | Fair 97.9% |
| Immigrants | Kenya | 24.1 /100 | #198 | Fair 97.9% |
| Immigrants | Egypt | 22.5 /100 | #199 | Fair 97.9% |
| Tohono O'odham | 22.2 /100 | #200 | Fair 97.9% |
| Immigrants | Lebanon | 21.2 /100 | #201 | Fair 97.9% |
| Immigrants | Ukraine | 19.9 /100 | #202 | Poor 97.9% |
| Immigrants | Uganda | 18.0 /100 | #203 | Poor 97.9% |
| Immigrants | Southern Europe | 17.4 /100 | #204 | Poor 97.9% |
| Immigrants | Chile | 17.3 /100 | #205 | Poor 97.9% |