Immigrants from Kazakhstan vs Haitian Nursery School
COMPARE
Immigrants from Kazakhstan
Haitian
Nursery School
Nursery School Comparison
Immigrants from Kazakhstan
Haitians
97.9%
NURSERY SCHOOL
37.1/ 100
METRIC RATING
187th/ 347
METRIC RANK
97.2%
NURSERY SCHOOL
0.0/ 100
METRIC RATING
300th/ 347
METRIC RANK
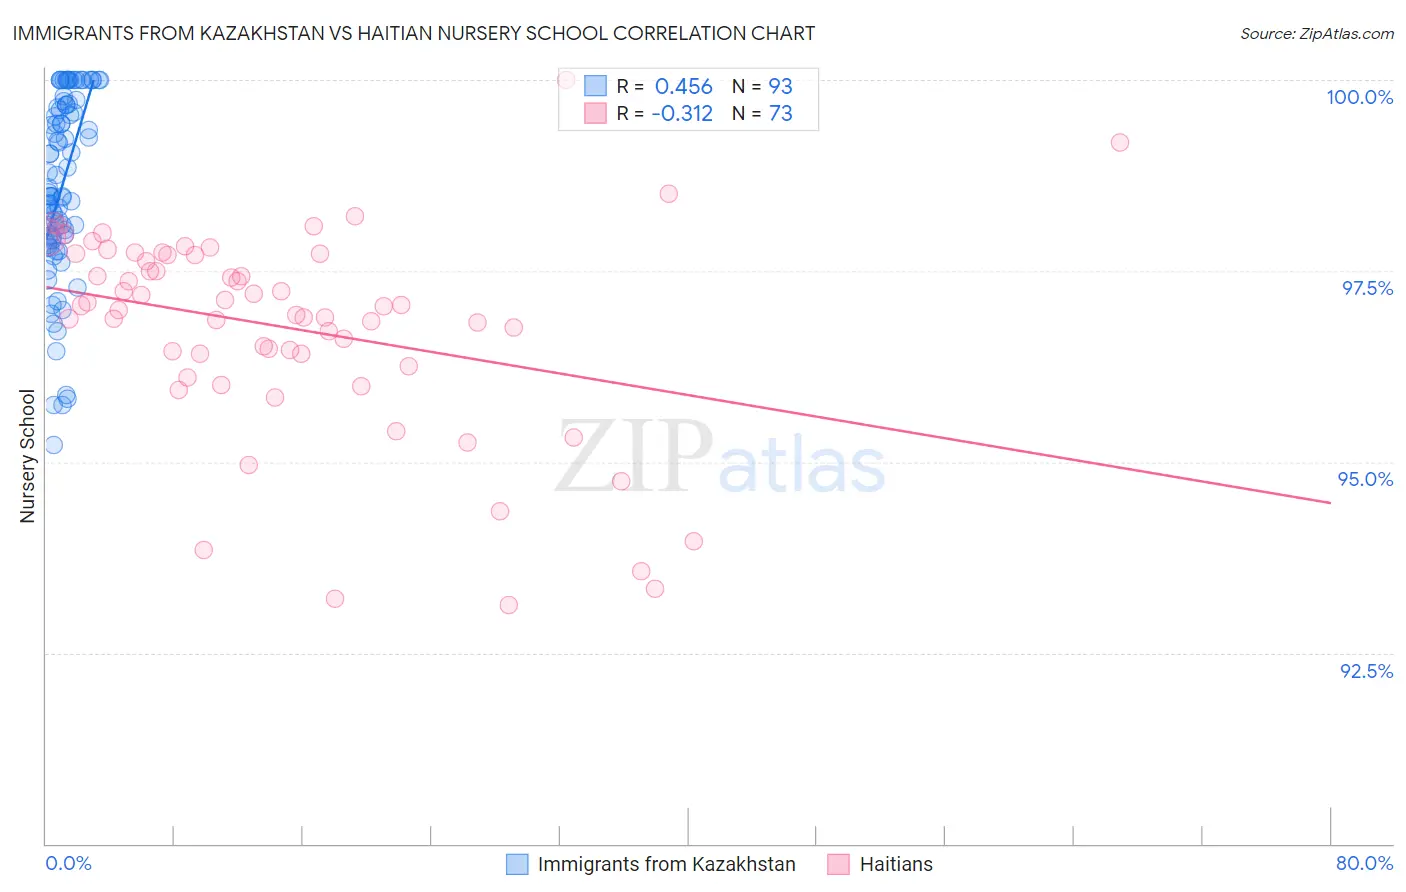
Immigrants from Kazakhstan vs Haitian Nursery School Correlation Chart
The statistical analysis conducted on geographies consisting of 124,444,388 people shows a moderate positive correlation between the proportion of Immigrants from Kazakhstan and percentage of population with at least nursery school education in the United States with a correlation coefficient (R) of 0.456 and weighted average of 97.9%. Similarly, the statistical analysis conducted on geographies consisting of 288,018,638 people shows a mild negative correlation between the proportion of Haitians and percentage of population with at least nursery school education in the United States with a correlation coefficient (R) of -0.312 and weighted average of 97.2%, a difference of 0.80%.
Nursery School Correlation Summary
| Measurement | Immigrants from Kazakhstan | Haitian |
| Minimum | 95.2% | 93.1% |
| Maximum | 100.0% | 100.0% |
| Range | 4.8% | 6.9% |
| Mean | 98.6% | 96.8% |
| Median | 98.5% | 97.0% |
| Interquartile 25% (IQ1) | 97.9% | 96.3% |
| Interquartile 75% (IQ3) | 99.7% | 97.7% |
| Interquartile Range (IQR) | 1.7% | 1.4% |
| Standard Deviation (Sample) | 1.2% | 1.4% |
| Standard Deviation (Population) | 1.2% | 1.4% |
Similar Demographics by Nursery School
Demographics Similar to Immigrants from Kazakhstan by Nursery School
In terms of nursery school, the demographic groups most similar to Immigrants from Kazakhstan are Portuguese (98.0%, a difference of 0.010%), Immigrants from Poland (98.0%, a difference of 0.010%), Immigrants from Belarus (98.0%, a difference of 0.010%), Immigrants from Argentina (98.0%, a difference of 0.010%), and Arab (97.9%, a difference of 0.010%).
| Demographics | Rating | Rank | Nursery School |
| Immigrants | Bosnia and Herzegovina | 45.6 /100 | #180 | Average 98.0% |
| Egyptians | 42.8 /100 | #181 | Average 98.0% |
| Paiute | 42.0 /100 | #182 | Average 98.0% |
| Portuguese | 41.8 /100 | #183 | Average 98.0% |
| Immigrants | Poland | 41.3 /100 | #184 | Average 98.0% |
| Immigrants | Belarus | 41.0 /100 | #185 | Average 98.0% |
| Immigrants | Argentina | 40.8 /100 | #186 | Average 98.0% |
| Immigrants | Kazakhstan | 37.1 /100 | #187 | Fair 97.9% |
| Arabs | 34.7 /100 | #188 | Fair 97.9% |
| Pakistanis | 34.6 /100 | #189 | Fair 97.9% |
| Panamanians | 34.3 /100 | #190 | Fair 97.9% |
| Immigrants | Taiwan | 30.6 /100 | #191 | Fair 97.9% |
| Blacks/African Americans | 29.4 /100 | #192 | Fair 97.9% |
| Paraguayans | 27.4 /100 | #193 | Fair 97.9% |
| Mongolians | 27.3 /100 | #194 | Fair 97.9% |
Demographics Similar to Haitians by Nursery School
In terms of nursery school, the demographic groups most similar to Haitians are Immigrants from Dominica (97.2%, a difference of 0.010%), Central American Indian (97.2%, a difference of 0.020%), Immigrants from Cuba (97.2%, a difference of 0.030%), Immigrants from South Eastern Asia (97.1%, a difference of 0.030%), and Immigrants from Caribbean (97.1%, a difference of 0.060%).
| Demographics | Rating | Rank | Nursery School |
| Malaysians | 0.0 /100 | #293 | Tragic 97.3% |
| Immigrants | Grenada | 0.0 /100 | #294 | Tragic 97.3% |
| Immigrants | Immigrants | 0.0 /100 | #295 | Tragic 97.2% |
| Immigrants | Eritrea | 0.0 /100 | #296 | Tragic 97.2% |
| Immigrants | Cuba | 0.0 /100 | #297 | Tragic 97.2% |
| Central American Indians | 0.0 /100 | #298 | Tragic 97.2% |
| Immigrants | Dominica | 0.0 /100 | #299 | Tragic 97.2% |
| Haitians | 0.0 /100 | #300 | Tragic 97.2% |
| Immigrants | South Eastern Asia | 0.0 /100 | #301 | Tragic 97.1% |
| Immigrants | Caribbean | 0.0 /100 | #302 | Tragic 97.1% |
| Nicaraguans | 0.0 /100 | #303 | Tragic 97.1% |
| Ecuadorians | 0.0 /100 | #304 | Tragic 97.1% |
| Somalis | 0.0 /100 | #305 | Tragic 97.1% |
| Belizeans | 0.0 /100 | #306 | Tragic 97.0% |
| Hispanics or Latinos | 0.0 /100 | #307 | Tragic 97.0% |