Immigrants from Kazakhstan vs Immigrants from Kenya No Schooling Completed
COMPARE
Immigrants from Kazakhstan
Immigrants from Kenya
No Schooling Completed
No Schooling Completed Comparison
Immigrants from Kazakhstan
Immigrants from Kenya
2.1%
NO SCHOOLING COMPLETED
44.3/ 100
METRIC RATING
179th/ 347
METRIC RANK
2.1%
NO SCHOOLING COMPLETED
36.2/ 100
METRIC RATING
188th/ 347
METRIC RANK
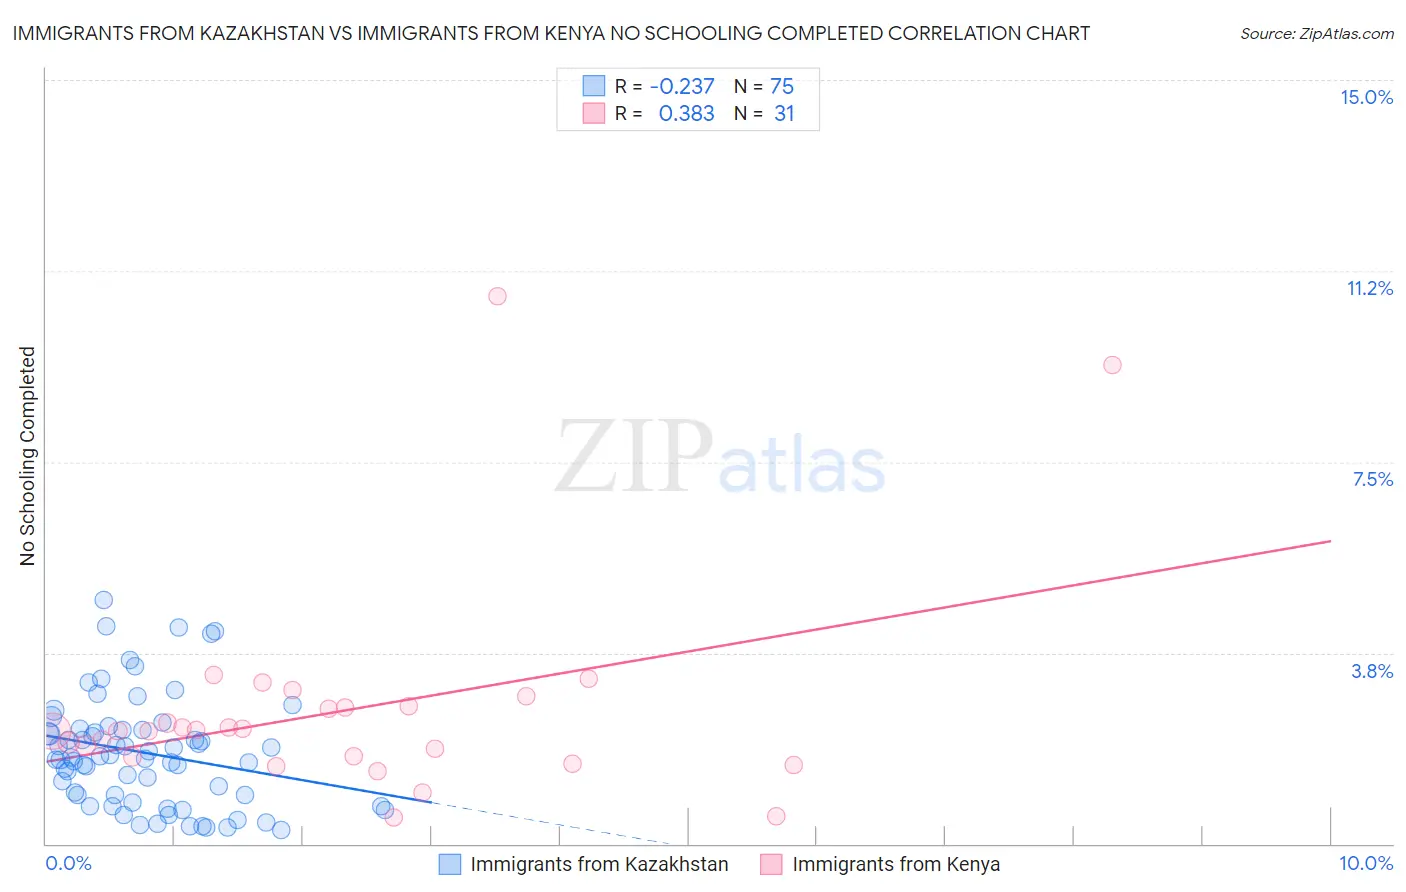
Immigrants from Kazakhstan vs Immigrants from Kenya No Schooling Completed Correlation Chart
The statistical analysis conducted on geographies consisting of 123,956,423 people shows a weak negative correlation between the proportion of Immigrants from Kazakhstan and percentage of population with no schooling in the United States with a correlation coefficient (R) of -0.237 and weighted average of 2.1%. Similarly, the statistical analysis conducted on geographies consisting of 217,120,357 people shows a mild positive correlation between the proportion of Immigrants from Kenya and percentage of population with no schooling in the United States with a correlation coefficient (R) of 0.383 and weighted average of 2.1%, a difference of 1.1%.
No Schooling Completed Correlation Summary
| Measurement | Immigrants from Kazakhstan | Immigrants from Kenya |
| Minimum | 0.26% | 0.53% |
| Maximum | 4.8% | 10.7% |
| Range | 4.5% | 10.2% |
| Mean | 1.8% | 2.6% |
| Median | 1.7% | 2.2% |
| Interquartile 25% (IQ1) | 0.95% | 1.7% |
| Interquartile 75% (IQ3) | 2.2% | 2.7% |
| Interquartile Range (IQR) | 1.3% | 0.99% |
| Standard Deviation (Sample) | 1.1% | 2.1% |
| Standard Deviation (Population) | 1.1% | 2.1% |
Demographics Similar to Immigrants from Kazakhstan and Immigrants from Kenya by No Schooling Completed
In terms of no schooling completed, the demographic groups most similar to Immigrants from Kazakhstan are Pakistani (2.1%, a difference of 0.050%), Portuguese (2.1%, a difference of 0.060%), Arapaho (2.1%, a difference of 0.10%), Panamanian (2.1%, a difference of 0.11%), and Immigrants from Taiwan (2.1%, a difference of 0.24%). Similarly, the demographic groups most similar to Immigrants from Kenya are Immigrants from Egypt (2.1%, a difference of 0.010%), Navajo (2.1%, a difference of 0.050%), Immigrants from Bosnia and Herzegovina (2.1%, a difference of 0.35%), Spanish American (2.1%, a difference of 0.52%), and Mongolian (2.1%, a difference of 0.65%).
| Demographics | Rating | Rank | No Schooling Completed |
| Immigrants | Belarus | 51.8 /100 | #173 | Average 2.1% |
| Immigrants | Micronesia | 50.0 /100 | #174 | Average 2.1% |
| Arabs | 46.4 /100 | #175 | Average 2.1% |
| Panamanians | 45.2 /100 | #176 | Average 2.1% |
| Arapaho | 45.0 /100 | #177 | Average 2.1% |
| Pakistanis | 44.7 /100 | #178 | Average 2.1% |
| Immigrants | Kazakhstan | 44.3 /100 | #179 | Average 2.1% |
| Portuguese | 43.9 /100 | #180 | Average 2.1% |
| Immigrants | Taiwan | 42.6 /100 | #181 | Average 2.1% |
| French American Indians | 42.2 /100 | #182 | Average 2.1% |
| Blacks/African Americans | 41.4 /100 | #183 | Average 2.1% |
| Pima | 41.3 /100 | #184 | Average 2.1% |
| Mongolians | 40.8 /100 | #185 | Average 2.1% |
| Immigrants | Bosnia and Herzegovina | 38.6 /100 | #186 | Fair 2.1% |
| Navajo | 36.5 /100 | #187 | Fair 2.1% |
| Immigrants | Kenya | 36.2 /100 | #188 | Fair 2.1% |
| Immigrants | Egypt | 36.1 /100 | #189 | Fair 2.1% |
| Spanish Americans | 32.6 /100 | #190 | Fair 2.1% |
| Bermudans | 30.7 /100 | #191 | Fair 2.1% |
| Guamanians/Chamorros | 29.8 /100 | #192 | Fair 2.2% |
| Paraguayans | 29.3 /100 | #193 | Fair 2.2% |