Immigrants from Kazakhstan vs Chilean Nursery School
COMPARE
Immigrants from Kazakhstan
Chilean
Nursery School
Nursery School Comparison
Immigrants from Kazakhstan
Chileans
97.9%
NURSERY SCHOOL
37.1/ 100
METRIC RATING
187th/ 347
METRIC RANK
98.0%
NURSERY SCHOOL
56.4/ 100
METRIC RATING
165th/ 347
METRIC RANK
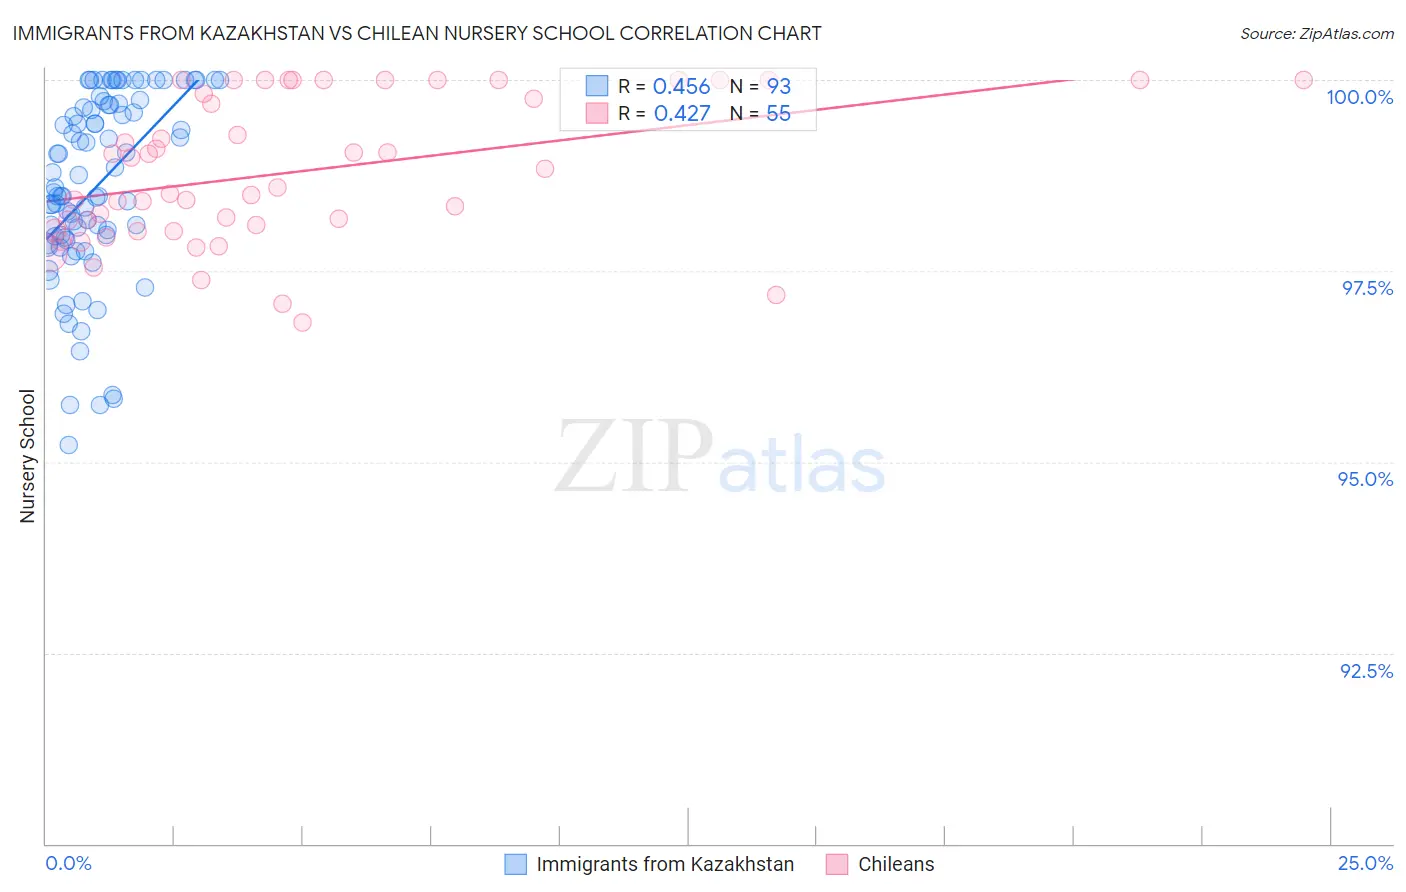
Immigrants from Kazakhstan vs Chilean Nursery School Correlation Chart
The statistical analysis conducted on geographies consisting of 124,444,388 people shows a moderate positive correlation between the proportion of Immigrants from Kazakhstan and percentage of population with at least nursery school education in the United States with a correlation coefficient (R) of 0.456 and weighted average of 97.9%. Similarly, the statistical analysis conducted on geographies consisting of 256,684,337 people shows a moderate positive correlation between the proportion of Chileans and percentage of population with at least nursery school education in the United States with a correlation coefficient (R) of 0.427 and weighted average of 98.0%, a difference of 0.060%.
Nursery School Correlation Summary
| Measurement | Immigrants from Kazakhstan | Chilean |
| Minimum | 95.2% | 96.8% |
| Maximum | 100.0% | 100.0% |
| Range | 4.8% | 3.2% |
| Mean | 98.6% | 98.8% |
| Median | 98.5% | 98.6% |
| Interquartile 25% (IQ1) | 97.9% | 98.0% |
| Interquartile 75% (IQ3) | 99.7% | 100.0% |
| Interquartile Range (IQR) | 1.7% | 2.0% |
| Standard Deviation (Sample) | 1.2% | 0.94% |
| Standard Deviation (Population) | 1.2% | 0.93% |
Similar Demographics by Nursery School
Demographics Similar to Immigrants from Kazakhstan by Nursery School
In terms of nursery school, the demographic groups most similar to Immigrants from Kazakhstan are Portuguese (98.0%, a difference of 0.010%), Immigrants from Poland (98.0%, a difference of 0.010%), Immigrants from Belarus (98.0%, a difference of 0.010%), Immigrants from Argentina (98.0%, a difference of 0.010%), and Arab (97.9%, a difference of 0.010%).
| Demographics | Rating | Rank | Nursery School |
| Immigrants | Bosnia and Herzegovina | 45.6 /100 | #180 | Average 98.0% |
| Egyptians | 42.8 /100 | #181 | Average 98.0% |
| Paiute | 42.0 /100 | #182 | Average 98.0% |
| Portuguese | 41.8 /100 | #183 | Average 98.0% |
| Immigrants | Poland | 41.3 /100 | #184 | Average 98.0% |
| Immigrants | Belarus | 41.0 /100 | #185 | Average 98.0% |
| Immigrants | Argentina | 40.8 /100 | #186 | Average 98.0% |
| Immigrants | Kazakhstan | 37.1 /100 | #187 | Fair 97.9% |
| Arabs | 34.7 /100 | #188 | Fair 97.9% |
| Pakistanis | 34.6 /100 | #189 | Fair 97.9% |
| Panamanians | 34.3 /100 | #190 | Fair 97.9% |
| Immigrants | Taiwan | 30.6 /100 | #191 | Fair 97.9% |
| Blacks/African Americans | 29.4 /100 | #192 | Fair 97.9% |
| Paraguayans | 27.4 /100 | #193 | Fair 97.9% |
| Mongolians | 27.3 /100 | #194 | Fair 97.9% |
Demographics Similar to Chileans by Nursery School
In terms of nursery school, the demographic groups most similar to Chileans are Ugandan (98.0%, a difference of 0.0%), Spanish American (98.0%, a difference of 0.0%), Immigrants from Spain (98.0%, a difference of 0.0%), Immigrants from Micronesia (98.0%, a difference of 0.0%), and Immigrants from Russia (98.0%, a difference of 0.010%).
| Demographics | Rating | Rank | Nursery School |
| Immigrants | North Macedonia | 65.7 /100 | #158 | Good 98.0% |
| French American Indians | 62.1 /100 | #159 | Good 98.0% |
| Immigrants | Russia | 59.9 /100 | #160 | Average 98.0% |
| Immigrants | Eastern Europe | 59.7 /100 | #161 | Average 98.0% |
| Brazilians | 59.4 /100 | #162 | Average 98.0% |
| Immigrants | Italy | 59.0 /100 | #163 | Average 98.0% |
| Ugandans | 56.4 /100 | #164 | Average 98.0% |
| Chileans | 56.4 /100 | #165 | Average 98.0% |
| Spanish Americans | 55.6 /100 | #166 | Average 98.0% |
| Immigrants | Spain | 55.6 /100 | #167 | Average 98.0% |
| Immigrants | Micronesia | 55.0 /100 | #168 | Average 98.0% |
| Immigrants | Korea | 53.8 /100 | #169 | Average 98.0% |
| Bermudans | 53.7 /100 | #170 | Average 98.0% |
| Immigrants | Jordan | 53.4 /100 | #171 | Average 98.0% |
| Immigrants | Brazil | 51.3 /100 | #172 | Average 98.0% |