Immigrants from Kazakhstan vs Immigrants from Albania Nursery School
COMPARE
Immigrants from Kazakhstan
Immigrants from Albania
Nursery School
Nursery School Comparison
Immigrants from Kazakhstan
Immigrants from Albania
97.9%
NURSERY SCHOOL
37.1/ 100
METRIC RATING
187th/ 347
METRIC RANK
97.9%
NURSERY SCHOOL
16.4/ 100
METRIC RATING
206th/ 347
METRIC RANK
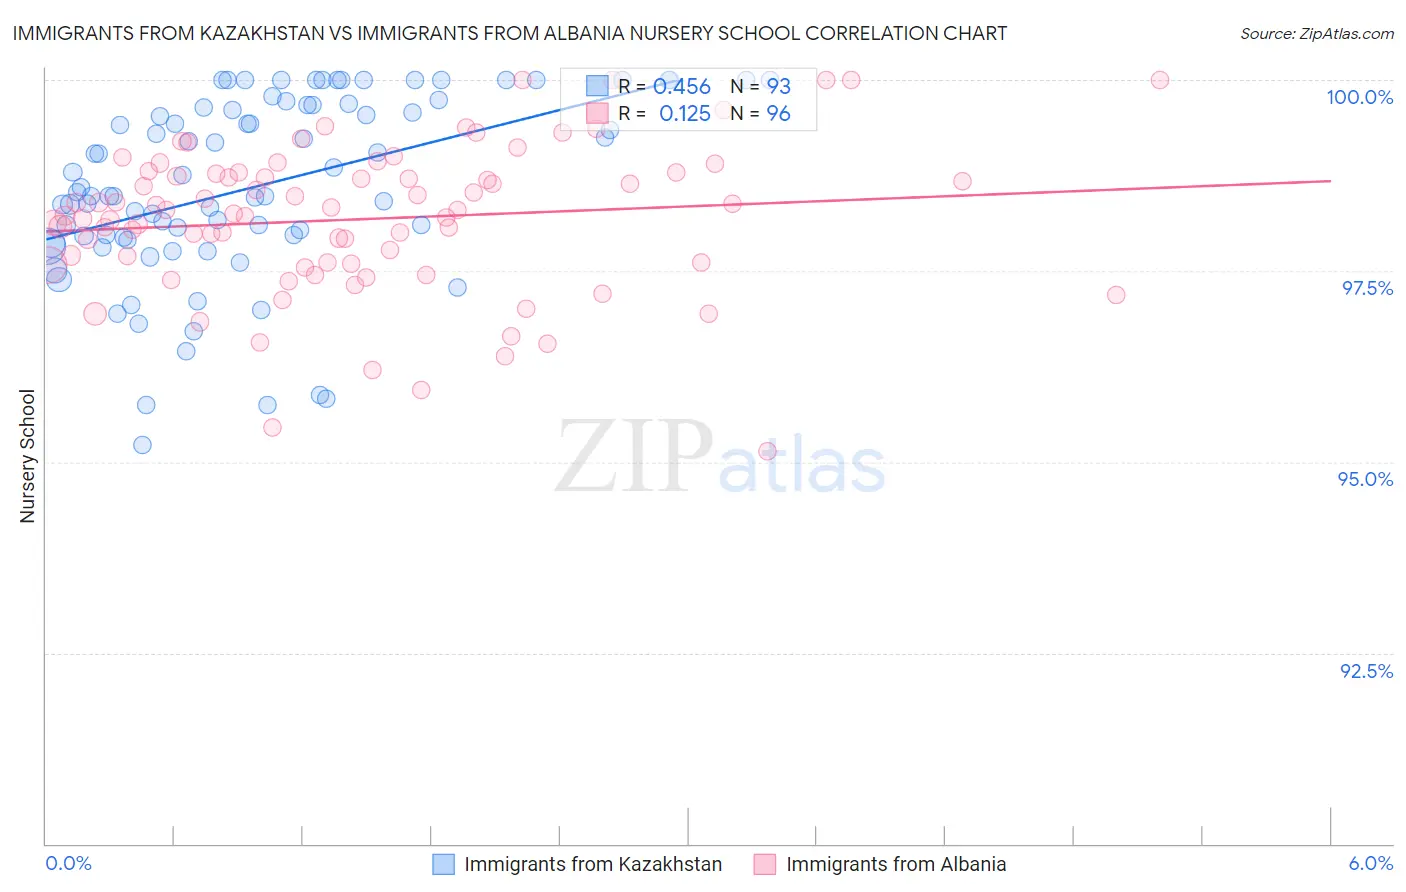
Immigrants from Kazakhstan vs Immigrants from Albania Nursery School Correlation Chart
The statistical analysis conducted on geographies consisting of 124,444,388 people shows a moderate positive correlation between the proportion of Immigrants from Kazakhstan and percentage of population with at least nursery school education in the United States with a correlation coefficient (R) of 0.456 and weighted average of 97.9%. Similarly, the statistical analysis conducted on geographies consisting of 119,263,578 people shows a poor positive correlation between the proportion of Immigrants from Albania and percentage of population with at least nursery school education in the United States with a correlation coefficient (R) of 0.125 and weighted average of 97.9%, a difference of 0.080%.
Nursery School Correlation Summary
| Measurement | Immigrants from Kazakhstan | Immigrants from Albania |
| Minimum | 95.2% | 95.1% |
| Maximum | 100.0% | 100.0% |
| Range | 4.8% | 4.9% |
| Mean | 98.6% | 98.2% |
| Median | 98.5% | 98.3% |
| Interquartile 25% (IQ1) | 97.9% | 97.6% |
| Interquartile 75% (IQ3) | 99.7% | 98.8% |
| Interquartile Range (IQR) | 1.7% | 1.2% |
| Standard Deviation (Sample) | 1.2% | 0.97% |
| Standard Deviation (Population) | 1.2% | 0.97% |
Demographics Similar to Immigrants from Kazakhstan and Immigrants from Albania by Nursery School
In terms of nursery school, the demographic groups most similar to Immigrants from Kazakhstan are Immigrants from Argentina (98.0%, a difference of 0.010%), Arab (97.9%, a difference of 0.010%), Pakistani (97.9%, a difference of 0.010%), Panamanian (97.9%, a difference of 0.010%), and Immigrants from Taiwan (97.9%, a difference of 0.020%). Similarly, the demographic groups most similar to Immigrants from Albania are Immigrants from Chile (97.9%, a difference of 0.0%), Immigrants from Uganda (97.9%, a difference of 0.010%), Immigrants from Southern Europe (97.9%, a difference of 0.010%), Immigrants from Lebanon (97.9%, a difference of 0.020%), and Immigrants from Ukraine (97.9%, a difference of 0.020%).
| Demographics | Rating | Rank | Nursery School |
| Immigrants | Argentina | 40.8 /100 | #186 | Average 98.0% |
| Immigrants | Kazakhstan | 37.1 /100 | #187 | Fair 97.9% |
| Arabs | 34.7 /100 | #188 | Fair 97.9% |
| Pakistanis | 34.6 /100 | #189 | Fair 97.9% |
| Panamanians | 34.3 /100 | #190 | Fair 97.9% |
| Immigrants | Taiwan | 30.6 /100 | #191 | Fair 97.9% |
| Blacks/African Americans | 29.4 /100 | #192 | Fair 97.9% |
| Paraguayans | 27.4 /100 | #193 | Fair 97.9% |
| Mongolians | 27.3 /100 | #194 | Fair 97.9% |
| Hawaiians | 27.2 /100 | #195 | Fair 97.9% |
| Guamanians/Chamorros | 25.7 /100 | #196 | Fair 97.9% |
| Yuman | 25.7 /100 | #197 | Fair 97.9% |
| Immigrants | Kenya | 24.1 /100 | #198 | Fair 97.9% |
| Immigrants | Egypt | 22.5 /100 | #199 | Fair 97.9% |
| Tohono O'odham | 22.2 /100 | #200 | Fair 97.9% |
| Immigrants | Lebanon | 21.2 /100 | #201 | Fair 97.9% |
| Immigrants | Ukraine | 19.9 /100 | #202 | Poor 97.9% |
| Immigrants | Uganda | 18.0 /100 | #203 | Poor 97.9% |
| Immigrants | Southern Europe | 17.4 /100 | #204 | Poor 97.9% |
| Immigrants | Chile | 17.3 /100 | #205 | Poor 97.9% |
| Immigrants | Albania | 16.4 /100 | #206 | Poor 97.9% |