Immigrants from Jordan vs Immigrants from South Eastern Asia 7th Grade
COMPARE
Immigrants from Jordan
Immigrants from South Eastern Asia
7th Grade
7th Grade Comparison
Immigrants from Jordan
Immigrants from South Eastern Asia
96.2%
7TH GRADE
77.0/ 100
METRIC RATING
155th/ 347
METRIC RANK
94.5%
7TH GRADE
0.0/ 100
METRIC RATING
297th/ 347
METRIC RANK
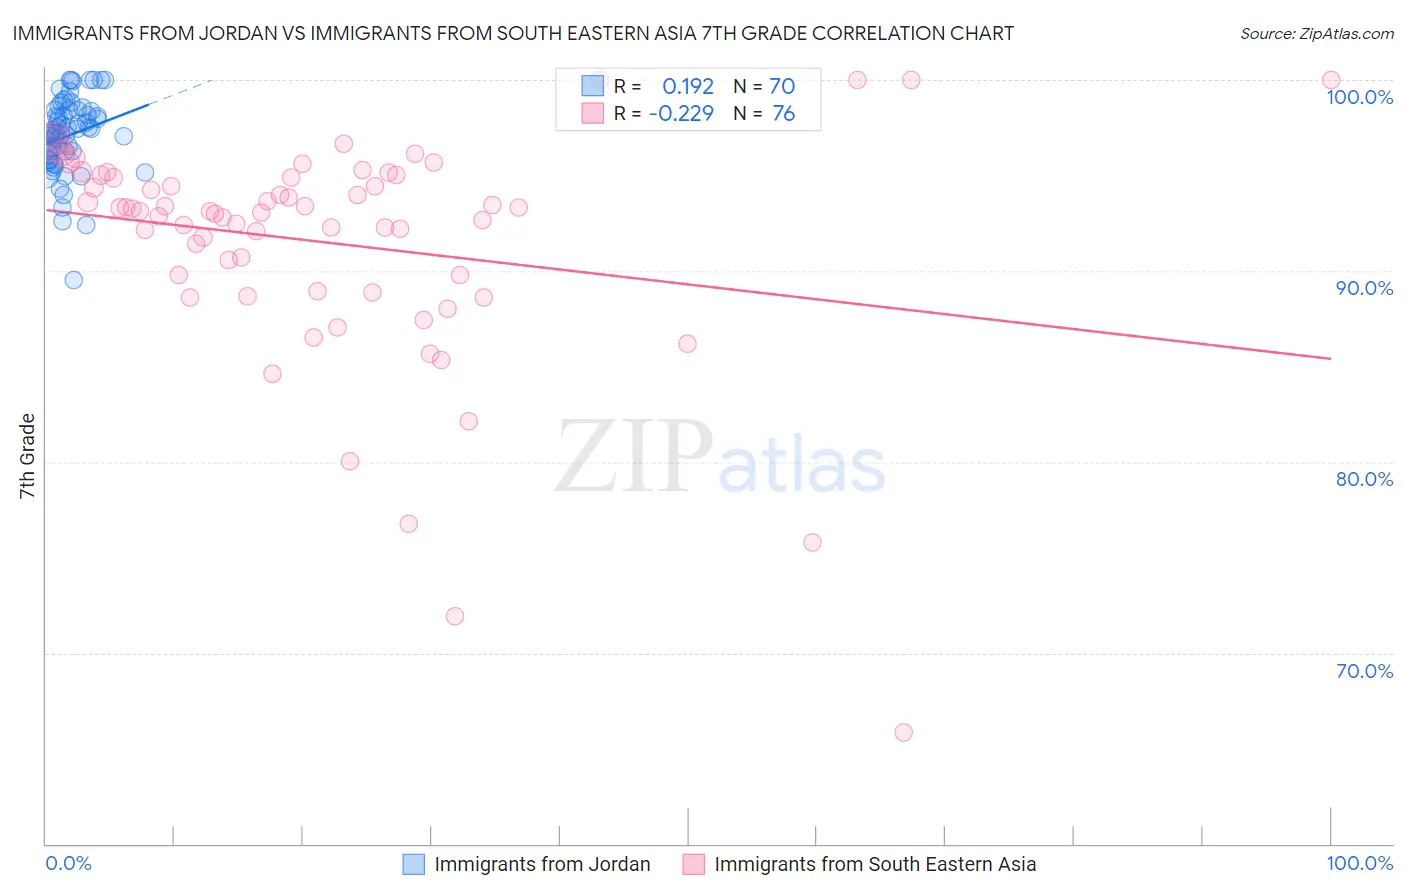
Immigrants from Jordan vs Immigrants from South Eastern Asia 7th Grade Correlation Chart
The statistical analysis conducted on geographies consisting of 181,269,353 people shows a poor positive correlation between the proportion of Immigrants from Jordan and percentage of population with at least 7th grade education in the United States with a correlation coefficient (R) of 0.192 and weighted average of 96.2%. Similarly, the statistical analysis conducted on geographies consisting of 512,710,223 people shows a weak negative correlation between the proportion of Immigrants from South Eastern Asia and percentage of population with at least 7th grade education in the United States with a correlation coefficient (R) of -0.229 and weighted average of 94.5%, a difference of 1.8%.
7th Grade Correlation Summary
| Measurement | Immigrants from Jordan | Immigrants from South Eastern Asia |
| Minimum | 89.5% | 65.9% |
| Maximum | 100.0% | 100.0% |
| Range | 10.5% | 34.1% |
| Mean | 97.1% | 91.5% |
| Median | 97.3% | 93.1% |
| Interquartile 25% (IQ1) | 96.1% | 89.4% |
| Interquartile 75% (IQ3) | 98.4% | 94.9% |
| Interquartile Range (IQR) | 2.3% | 5.6% |
| Standard Deviation (Sample) | 2.0% | 6.0% |
| Standard Deviation (Population) | 2.0% | 5.9% |
Similar Demographics by 7th Grade
Demographics Similar to Immigrants from Jordan by 7th Grade
In terms of 7th grade, the demographic groups most similar to Immigrants from Jordan are Immigrants from Israel (96.2%, a difference of 0.0%), Immigrants from Russia (96.2%, a difference of 0.010%), Seminole (96.2%, a difference of 0.010%), Kenyan (96.2%, a difference of 0.010%), and Ugandan (96.2%, a difference of 0.010%).
| Demographics | Rating | Rank | 7th Grade |
| Israelis | 82.8 /100 | #148 | Excellent 96.3% |
| Albanians | 82.6 /100 | #149 | Excellent 96.3% |
| Immigrants | Belarus | 82.4 /100 | #150 | Excellent 96.3% |
| Hopi | 81.6 /100 | #151 | Excellent 96.3% |
| Immigrants | Russia | 78.4 /100 | #152 | Good 96.2% |
| Seminole | 78.1 /100 | #153 | Good 96.2% |
| Immigrants | Israel | 77.6 /100 | #154 | Good 96.2% |
| Immigrants | Jordan | 77.0 /100 | #155 | Good 96.2% |
| Kenyans | 76.2 /100 | #156 | Good 96.2% |
| Ugandans | 75.5 /100 | #157 | Good 96.2% |
| Arabs | 68.6 /100 | #158 | Good 96.2% |
| Alsatians | 67.2 /100 | #159 | Good 96.1% |
| Immigrants | Kenya | 66.8 /100 | #160 | Good 96.1% |
| Bermudans | 66.3 /100 | #161 | Good 96.1% |
| Pima | 64.3 /100 | #162 | Good 96.1% |
Demographics Similar to Immigrants from South Eastern Asia by 7th Grade
In terms of 7th grade, the demographic groups most similar to Immigrants from South Eastern Asia are Indonesian (94.5%, a difference of 0.0%), Bangladeshi (94.5%, a difference of 0.010%), Immigrants from Burma/Myanmar (94.5%, a difference of 0.040%), Immigrants from Dominica (94.5%, a difference of 0.080%), and Immigrants from Laos (94.5%, a difference of 0.080%).
| Demographics | Rating | Rank | 7th Grade |
| Malaysians | 0.0 /100 | #290 | Tragic 94.8% |
| Immigrants | Grenada | 0.0 /100 | #291 | Tragic 94.8% |
| Immigrants | West Indies | 0.0 /100 | #292 | Tragic 94.8% |
| Fijians | 0.0 /100 | #293 | Tragic 94.7% |
| Haitians | 0.0 /100 | #294 | Tragic 94.7% |
| Yaqui | 0.0 /100 | #295 | Tragic 94.6% |
| Cubans | 0.0 /100 | #296 | Tragic 94.6% |
| Immigrants | South Eastern Asia | 0.0 /100 | #297 | Tragic 94.5% |
| Indonesians | 0.0 /100 | #298 | Tragic 94.5% |
| Bangladeshis | 0.0 /100 | #299 | Tragic 94.5% |
| Immigrants | Burma/Myanmar | 0.0 /100 | #300 | Tragic 94.5% |
| Immigrants | Dominica | 0.0 /100 | #301 | Tragic 94.5% |
| Immigrants | Laos | 0.0 /100 | #302 | Tragic 94.5% |
| Sri Lankans | 0.0 /100 | #303 | Tragic 94.4% |
| Immigrants | Haiti | 0.0 /100 | #304 | Tragic 94.3% |