Immigrants from Jordan vs Shoshone 7th Grade
COMPARE
Immigrants from Jordan
Shoshone
7th Grade
7th Grade Comparison
Immigrants from Jordan
Shoshone
96.2%
7TH GRADE
77.0/ 100
METRIC RATING
155th/ 347
METRIC RANK
96.6%
7TH GRADE
98.1/ 100
METRIC RATING
104th/ 347
METRIC RANK
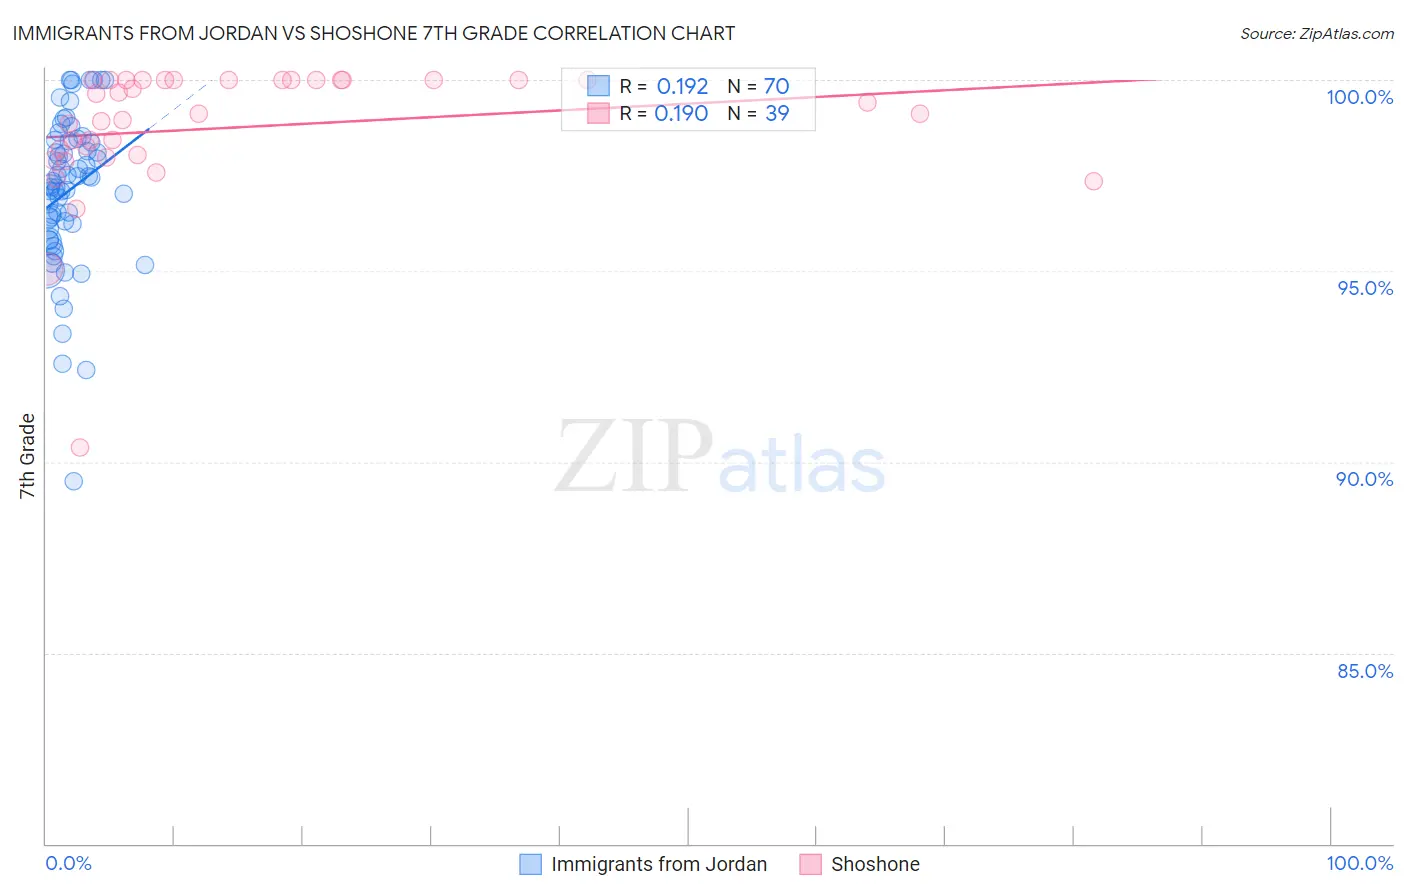
Immigrants from Jordan vs Shoshone 7th Grade Correlation Chart
The statistical analysis conducted on geographies consisting of 181,269,353 people shows a poor positive correlation between the proportion of Immigrants from Jordan and percentage of population with at least 7th grade education in the United States with a correlation coefficient (R) of 0.192 and weighted average of 96.2%. Similarly, the statistical analysis conducted on geographies consisting of 66,625,086 people shows a poor positive correlation between the proportion of Shoshone and percentage of population with at least 7th grade education in the United States with a correlation coefficient (R) of 0.190 and weighted average of 96.6%, a difference of 0.42%.
7th Grade Correlation Summary
| Measurement | Immigrants from Jordan | Shoshone |
| Minimum | 89.5% | 90.4% |
| Maximum | 100.0% | 100.0% |
| Range | 10.5% | 9.6% |
| Mean | 97.1% | 98.8% |
| Median | 97.3% | 99.1% |
| Interquartile 25% (IQ1) | 96.1% | 98.1% |
| Interquartile 75% (IQ3) | 98.4% | 100.0% |
| Interquartile Range (IQR) | 2.3% | 1.9% |
| Standard Deviation (Sample) | 2.0% | 1.8% |
| Standard Deviation (Population) | 2.0% | 1.8% |
Similar Demographics by 7th Grade
Demographics Similar to Immigrants from Jordan by 7th Grade
In terms of 7th grade, the demographic groups most similar to Immigrants from Jordan are Immigrants from Israel (96.2%, a difference of 0.0%), Immigrants from Russia (96.2%, a difference of 0.010%), Seminole (96.2%, a difference of 0.010%), Kenyan (96.2%, a difference of 0.010%), and Ugandan (96.2%, a difference of 0.010%).
| Demographics | Rating | Rank | 7th Grade |
| Israelis | 82.8 /100 | #148 | Excellent 96.3% |
| Albanians | 82.6 /100 | #149 | Excellent 96.3% |
| Immigrants | Belarus | 82.4 /100 | #150 | Excellent 96.3% |
| Hopi | 81.6 /100 | #151 | Excellent 96.3% |
| Immigrants | Russia | 78.4 /100 | #152 | Good 96.2% |
| Seminole | 78.1 /100 | #153 | Good 96.2% |
| Immigrants | Israel | 77.6 /100 | #154 | Good 96.2% |
| Immigrants | Jordan | 77.0 /100 | #155 | Good 96.2% |
| Kenyans | 76.2 /100 | #156 | Good 96.2% |
| Ugandans | 75.5 /100 | #157 | Good 96.2% |
| Arabs | 68.6 /100 | #158 | Good 96.2% |
| Alsatians | 67.2 /100 | #159 | Good 96.1% |
| Immigrants | Kenya | 66.8 /100 | #160 | Good 96.1% |
| Bermudans | 66.3 /100 | #161 | Good 96.1% |
| Pima | 64.3 /100 | #162 | Good 96.1% |
Demographics Similar to Shoshone by 7th Grade
In terms of 7th grade, the demographic groups most similar to Shoshone are South African (96.6%, a difference of 0.010%), Iroquois (96.6%, a difference of 0.010%), Immigrants from Czechoslovakia (96.6%, a difference of 0.020%), Immigrants from Singapore (96.6%, a difference of 0.020%), and Lumbee (96.6%, a difference of 0.020%).
| Demographics | Rating | Rank | 7th Grade |
| Immigrants | Germany | 98.7 /100 | #97 | Exceptional 96.7% |
| Immigrants | Sweden | 98.7 /100 | #98 | Exceptional 96.7% |
| Menominee | 98.7 /100 | #99 | Exceptional 96.7% |
| German Russians | 98.6 /100 | #100 | Exceptional 96.7% |
| Thais | 98.6 /100 | #101 | Exceptional 96.7% |
| Immigrants | Czechoslovakia | 98.3 /100 | #102 | Exceptional 96.6% |
| Immigrants | Singapore | 98.3 /100 | #103 | Exceptional 96.6% |
| Shoshone | 98.1 /100 | #104 | Exceptional 96.6% |
| South Africans | 98.0 /100 | #105 | Exceptional 96.6% |
| Iroquois | 97.9 /100 | #106 | Exceptional 96.6% |
| Lumbee | 97.8 /100 | #107 | Exceptional 96.6% |
| Immigrants | Saudi Arabia | 97.8 /100 | #108 | Exceptional 96.6% |
| Bhutanese | 97.7 /100 | #109 | Exceptional 96.6% |
| Okinawans | 97.4 /100 | #110 | Exceptional 96.6% |
| Immigrants | Latvia | 97.4 /100 | #111 | Exceptional 96.6% |