Ghanaian vs Shoshone 7th Grade
COMPARE
Ghanaian
Shoshone
7th Grade
7th Grade Comparison
Ghanaians
Shoshone
95.3%
7TH GRADE
0.7/ 100
METRIC RATING
258th/ 347
METRIC RANK
96.6%
7TH GRADE
98.1/ 100
METRIC RATING
104th/ 347
METRIC RANK
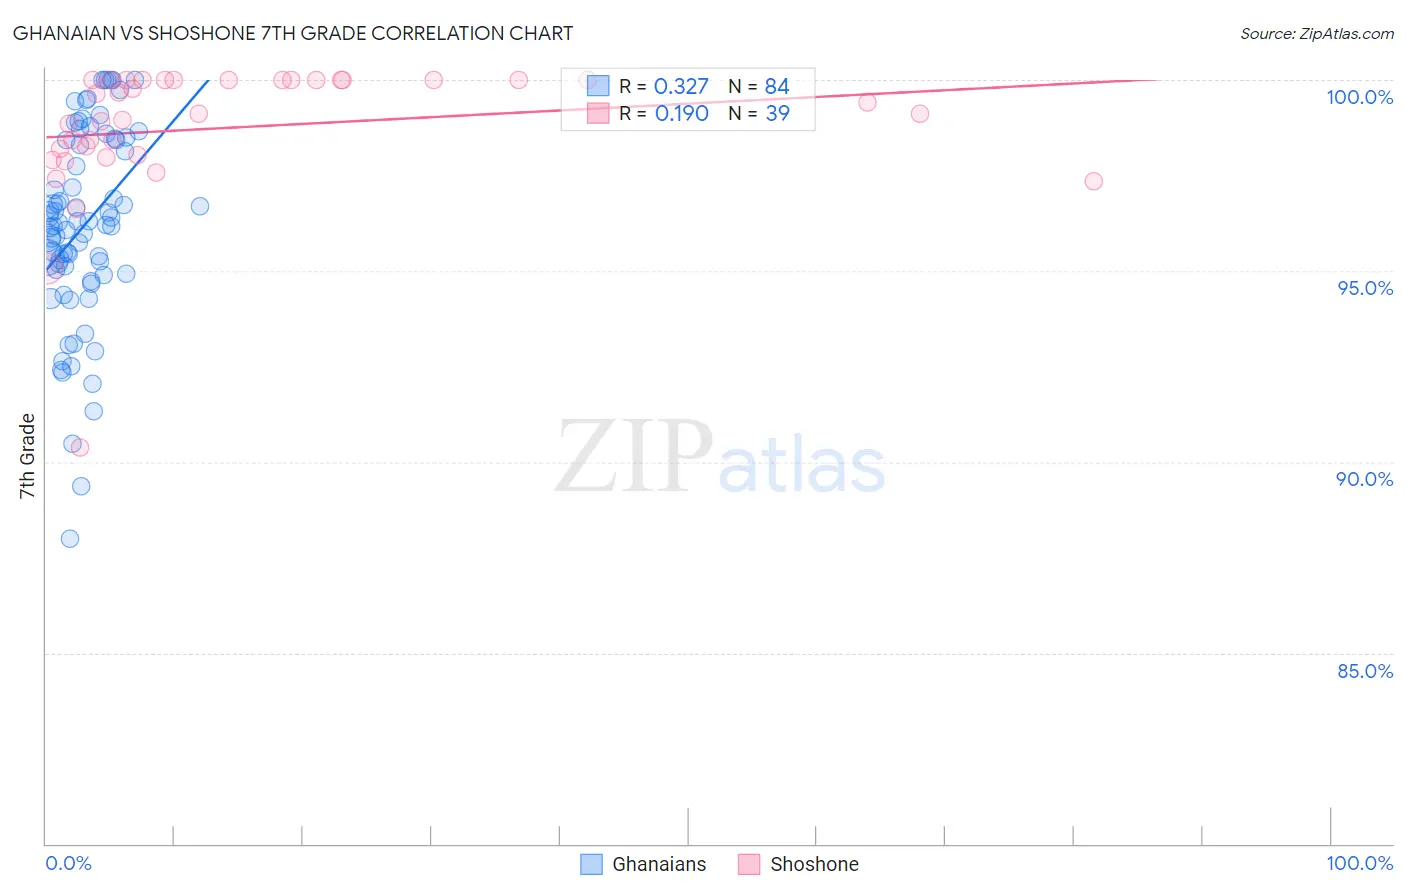
Ghanaian vs Shoshone 7th Grade Correlation Chart
The statistical analysis conducted on geographies consisting of 190,712,873 people shows a mild positive correlation between the proportion of Ghanaians and percentage of population with at least 7th grade education in the United States with a correlation coefficient (R) of 0.327 and weighted average of 95.3%. Similarly, the statistical analysis conducted on geographies consisting of 66,625,086 people shows a poor positive correlation between the proportion of Shoshone and percentage of population with at least 7th grade education in the United States with a correlation coefficient (R) of 0.190 and weighted average of 96.6%, a difference of 1.4%.
7th Grade Correlation Summary
| Measurement | Ghanaian | Shoshone |
| Minimum | 88.0% | 90.4% |
| Maximum | 100.0% | 100.0% |
| Range | 12.0% | 9.6% |
| Mean | 96.2% | 98.8% |
| Median | 96.2% | 99.1% |
| Interquartile 25% (IQ1) | 95.0% | 98.1% |
| Interquartile 75% (IQ3) | 98.4% | 100.0% |
| Interquartile Range (IQR) | 3.4% | 1.9% |
| Standard Deviation (Sample) | 2.5% | 1.8% |
| Standard Deviation (Population) | 2.5% | 1.8% |
Similar Demographics by 7th Grade
Demographics Similar to Ghanaians by 7th Grade
In terms of 7th grade, the demographic groups most similar to Ghanaians are Immigrants from China (95.3%, a difference of 0.0%), Immigrants from Congo (95.3%, a difference of 0.0%), Korean (95.3%, a difference of 0.010%), Colombian (95.3%, a difference of 0.020%), and Somali (95.3%, a difference of 0.030%).
| Demographics | Rating | Rank | 7th Grade |
| Immigrants | Jamaica | 0.9 /100 | #251 | Tragic 95.4% |
| Immigrants | Ethiopia | 0.9 /100 | #252 | Tragic 95.3% |
| Somalis | 0.9 /100 | #253 | Tragic 95.3% |
| Colombians | 0.8 /100 | #254 | Tragic 95.3% |
| Koreans | 0.8 /100 | #255 | Tragic 95.3% |
| Immigrants | China | 0.7 /100 | #256 | Tragic 95.3% |
| Immigrants | Congo | 0.7 /100 | #257 | Tragic 95.3% |
| Ghanaians | 0.7 /100 | #258 | Tragic 95.3% |
| Immigrants | Costa Rica | 0.6 /100 | #259 | Tragic 95.3% |
| Afghans | 0.5 /100 | #260 | Tragic 95.3% |
| South Americans | 0.5 /100 | #261 | Tragic 95.2% |
| Immigrants | Somalia | 0.5 /100 | #262 | Tragic 95.2% |
| West Indians | 0.5 /100 | #263 | Tragic 95.2% |
| Immigrants | Nigeria | 0.4 /100 | #264 | Tragic 95.2% |
| Immigrants | Uruguay | 0.3 /100 | #265 | Tragic 95.2% |
Demographics Similar to Shoshone by 7th Grade
In terms of 7th grade, the demographic groups most similar to Shoshone are South African (96.6%, a difference of 0.010%), Iroquois (96.6%, a difference of 0.010%), Immigrants from Czechoslovakia (96.6%, a difference of 0.020%), Immigrants from Singapore (96.6%, a difference of 0.020%), and Lumbee (96.6%, a difference of 0.020%).
| Demographics | Rating | Rank | 7th Grade |
| Immigrants | Germany | 98.7 /100 | #97 | Exceptional 96.7% |
| Immigrants | Sweden | 98.7 /100 | #98 | Exceptional 96.7% |
| Menominee | 98.7 /100 | #99 | Exceptional 96.7% |
| German Russians | 98.6 /100 | #100 | Exceptional 96.7% |
| Thais | 98.6 /100 | #101 | Exceptional 96.7% |
| Immigrants | Czechoslovakia | 98.3 /100 | #102 | Exceptional 96.6% |
| Immigrants | Singapore | 98.3 /100 | #103 | Exceptional 96.6% |
| Shoshone | 98.1 /100 | #104 | Exceptional 96.6% |
| South Africans | 98.0 /100 | #105 | Exceptional 96.6% |
| Iroquois | 97.9 /100 | #106 | Exceptional 96.6% |
| Lumbee | 97.8 /100 | #107 | Exceptional 96.6% |
| Immigrants | Saudi Arabia | 97.8 /100 | #108 | Exceptional 96.6% |
| Bhutanese | 97.7 /100 | #109 | Exceptional 96.6% |
| Okinawans | 97.4 /100 | #110 | Exceptional 96.6% |
| Immigrants | Latvia | 97.4 /100 | #111 | Exceptional 96.6% |