Immigrants from Trinidad and Tobago vs Shoshone 7th Grade
COMPARE
Immigrants from Trinidad and Tobago
Shoshone
7th Grade
7th Grade Comparison
Immigrants from Trinidad and Tobago
Shoshone
95.1%
7TH GRADE
0.1/ 100
METRIC RATING
278th/ 347
METRIC RANK
96.6%
7TH GRADE
98.1/ 100
METRIC RATING
104th/ 347
METRIC RANK
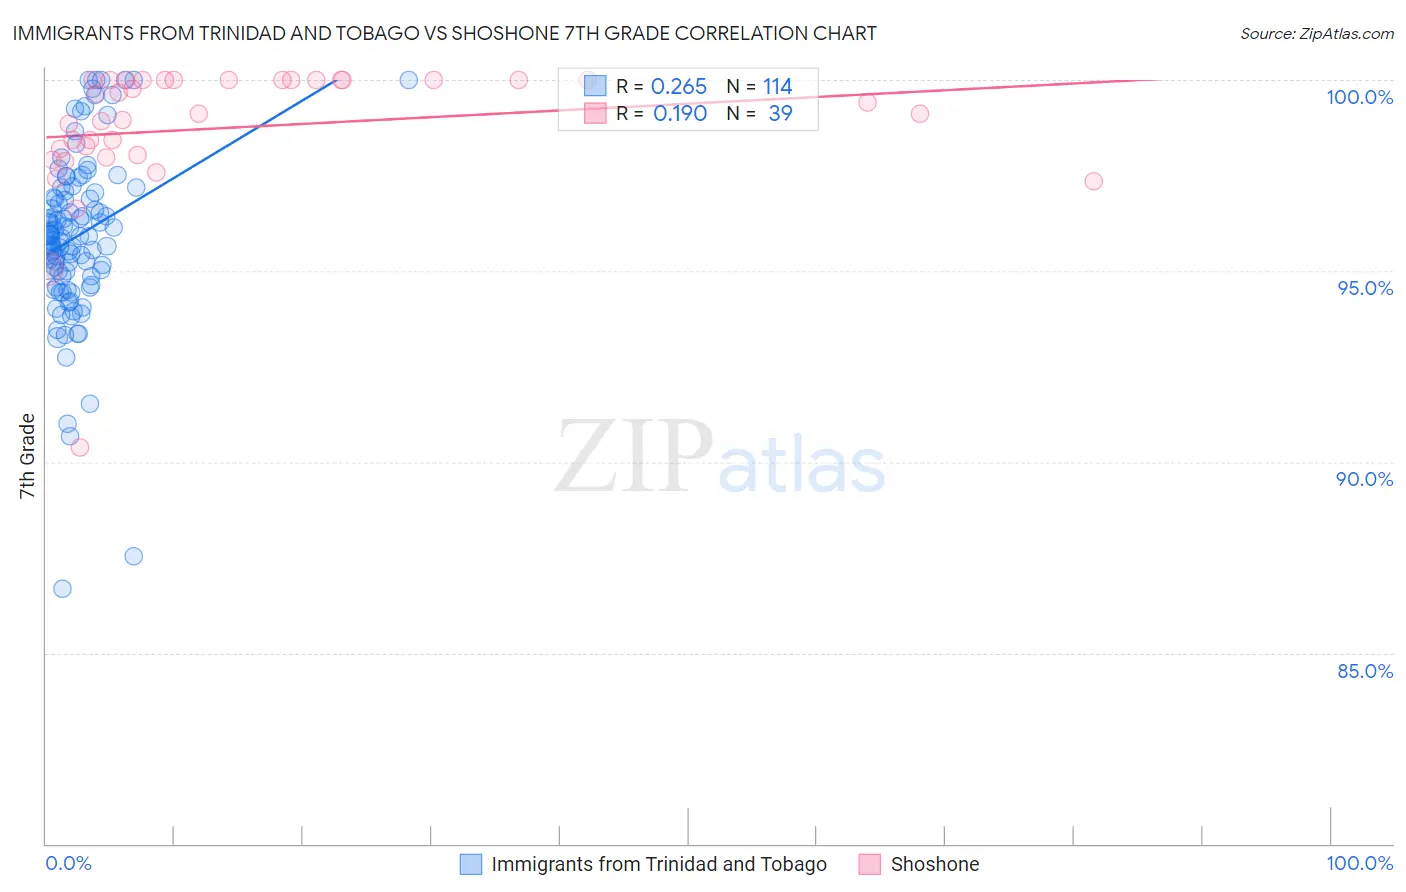
Immigrants from Trinidad and Tobago vs Shoshone 7th Grade Correlation Chart
The statistical analysis conducted on geographies consisting of 223,526,834 people shows a weak positive correlation between the proportion of Immigrants from Trinidad and Tobago and percentage of population with at least 7th grade education in the United States with a correlation coefficient (R) of 0.265 and weighted average of 95.1%. Similarly, the statistical analysis conducted on geographies consisting of 66,625,086 people shows a poor positive correlation between the proportion of Shoshone and percentage of population with at least 7th grade education in the United States with a correlation coefficient (R) of 0.190 and weighted average of 96.6%, a difference of 1.7%.
7th Grade Correlation Summary
| Measurement | Immigrants from Trinidad and Tobago | Shoshone |
| Minimum | 86.7% | 90.4% |
| Maximum | 100.0% | 100.0% |
| Range | 13.3% | 9.6% |
| Mean | 95.9% | 98.8% |
| Median | 95.9% | 99.1% |
| Interquartile 25% (IQ1) | 94.9% | 98.1% |
| Interquartile 75% (IQ3) | 97.1% | 100.0% |
| Interquartile Range (IQR) | 2.2% | 1.9% |
| Standard Deviation (Sample) | 2.2% | 1.8% |
| Standard Deviation (Population) | 2.2% | 1.8% |
Similar Demographics by 7th Grade
Demographics Similar to Immigrants from Trinidad and Tobago by 7th Grade
In terms of 7th grade, the demographic groups most similar to Immigrants from Trinidad and Tobago are Barbadian (95.1%, a difference of 0.010%), Immigrants from Afghanistan (95.1%, a difference of 0.030%), Immigrants from St. Vincent and the Grenadines (95.0%, a difference of 0.030%), Tohono O'odham (95.0%, a difference of 0.040%), and Immigrants from Thailand (95.1%, a difference of 0.050%).
| Demographics | Rating | Rank | 7th Grade |
| Immigrants | South America | 0.2 /100 | #271 | Tragic 95.1% |
| Peruvians | 0.2 /100 | #272 | Tragic 95.1% |
| Immigrants | Uzbekistan | 0.2 /100 | #273 | Tragic 95.1% |
| Immigrants | Western Africa | 0.2 /100 | #274 | Tragic 95.1% |
| Immigrants | Colombia | 0.2 /100 | #275 | Tragic 95.1% |
| Immigrants | Thailand | 0.2 /100 | #276 | Tragic 95.1% |
| Immigrants | Afghanistan | 0.2 /100 | #277 | Tragic 95.1% |
| Immigrants | Trinidad and Tobago | 0.1 /100 | #278 | Tragic 95.1% |
| Barbadians | 0.1 /100 | #279 | Tragic 95.1% |
| Immigrants | St. Vincent and the Grenadines | 0.1 /100 | #280 | Tragic 95.0% |
| Tohono O'odham | 0.1 /100 | #281 | Tragic 95.0% |
| Immigrants | Bolivia | 0.1 /100 | #282 | Tragic 95.0% |
| Immigrants | Barbados | 0.1 /100 | #283 | Tragic 95.0% |
| Armenians | 0.1 /100 | #284 | Tragic 95.0% |
| Immigrants | Eritrea | 0.1 /100 | #285 | Tragic 94.9% |
Demographics Similar to Shoshone by 7th Grade
In terms of 7th grade, the demographic groups most similar to Shoshone are South African (96.6%, a difference of 0.010%), Iroquois (96.6%, a difference of 0.010%), Immigrants from Czechoslovakia (96.6%, a difference of 0.020%), Immigrants from Singapore (96.6%, a difference of 0.020%), and Lumbee (96.6%, a difference of 0.020%).
| Demographics | Rating | Rank | 7th Grade |
| Immigrants | Germany | 98.7 /100 | #97 | Exceptional 96.7% |
| Immigrants | Sweden | 98.7 /100 | #98 | Exceptional 96.7% |
| Menominee | 98.7 /100 | #99 | Exceptional 96.7% |
| German Russians | 98.6 /100 | #100 | Exceptional 96.7% |
| Thais | 98.6 /100 | #101 | Exceptional 96.7% |
| Immigrants | Czechoslovakia | 98.3 /100 | #102 | Exceptional 96.6% |
| Immigrants | Singapore | 98.3 /100 | #103 | Exceptional 96.6% |
| Shoshone | 98.1 /100 | #104 | Exceptional 96.6% |
| South Africans | 98.0 /100 | #105 | Exceptional 96.6% |
| Iroquois | 97.9 /100 | #106 | Exceptional 96.6% |
| Lumbee | 97.8 /100 | #107 | Exceptional 96.6% |
| Immigrants | Saudi Arabia | 97.8 /100 | #108 | Exceptional 96.6% |
| Bhutanese | 97.7 /100 | #109 | Exceptional 96.6% |
| Okinawans | 97.4 /100 | #110 | Exceptional 96.6% |
| Immigrants | Latvia | 97.4 /100 | #111 | Exceptional 96.6% |