Immigrants from Iraq vs Marshallese 7th Grade
COMPARE
Immigrants from Iraq
Marshallese
7th Grade
7th Grade Comparison
Immigrants from Iraq
Marshallese
96.0%
7TH GRADE
36.1/ 100
METRIC RATING
186th/ 347
METRIC RANK
96.0%
7TH GRADE
48.4/ 100
METRIC RATING
178th/ 347
METRIC RANK
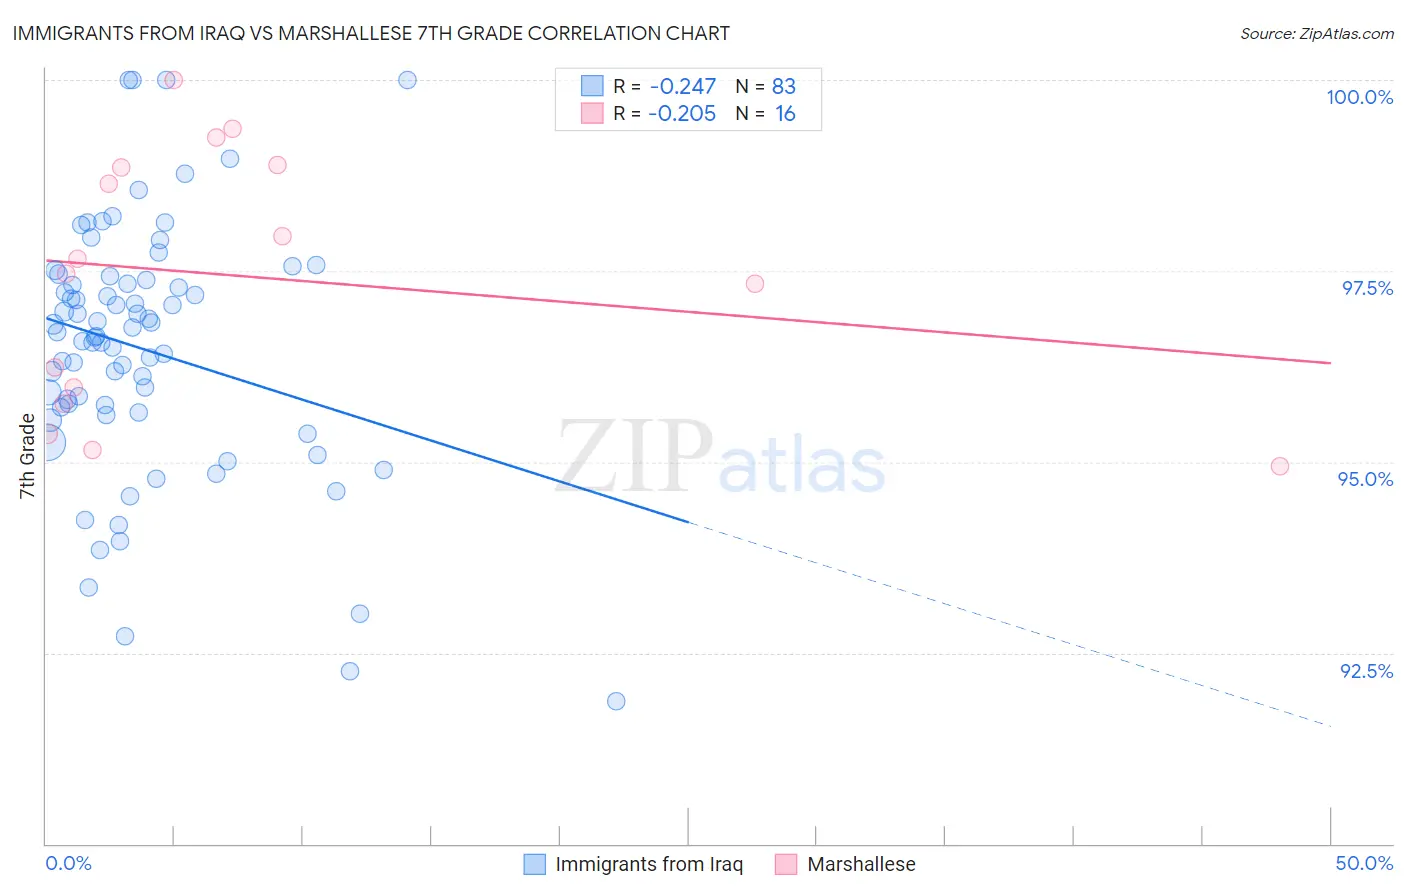
Immigrants from Iraq vs Marshallese 7th Grade Correlation Chart
The statistical analysis conducted on geographies consisting of 194,632,332 people shows a weak negative correlation between the proportion of Immigrants from Iraq and percentage of population with at least 7th grade education in the United States with a correlation coefficient (R) of -0.247 and weighted average of 96.0%. Similarly, the statistical analysis conducted on geographies consisting of 14,761,315 people shows a weak negative correlation between the proportion of Marshallese and percentage of population with at least 7th grade education in the United States with a correlation coefficient (R) of -0.205 and weighted average of 96.0%, a difference of 0.080%.
7th Grade Correlation Summary
| Measurement | Immigrants from Iraq | Marshallese |
| Minimum | 91.9% | 94.9% |
| Maximum | 100.0% | 100.0% |
| Range | 8.1% | 5.1% |
| Mean | 96.5% | 97.4% |
| Median | 96.6% | 97.6% |
| Interquartile 25% (IQ1) | 95.7% | 95.9% |
| Interquartile 75% (IQ3) | 97.4% | 98.9% |
| Interquartile Range (IQR) | 1.7% | 3.0% |
| Standard Deviation (Sample) | 1.7% | 1.7% |
| Standard Deviation (Population) | 1.6% | 1.6% |
Demographics Similar to Immigrants from Iraq and Marshallese by 7th Grade
In terms of 7th grade, the demographic groups most similar to Immigrants from Iraq are Immigrants from Uganda (96.0%, a difference of 0.0%), Sierra Leonean (96.0%, a difference of 0.010%), Brazilian (96.0%, a difference of 0.010%), Immigrants from Egypt (95.9%, a difference of 0.010%), and Immigrants from Venezuela (95.9%, a difference of 0.010%). Similarly, the demographic groups most similar to Marshallese are Immigrants from Korea (96.0%, a difference of 0.0%), Immigrants from Iran (96.0%, a difference of 0.0%), Immigrants from Albania (96.0%, a difference of 0.010%), Mongolian (96.0%, a difference of 0.010%), and Black/African American (96.0%, a difference of 0.010%).
| Demographics | Rating | Rank | 7th Grade |
| Venezuelans | 51.4 /100 | #172 | Average 96.0% |
| Immigrants | Albania | 50.4 /100 | #173 | Average 96.0% |
| Mongolians | 50.0 /100 | #174 | Average 96.0% |
| Blacks/African Americans | 49.5 /100 | #175 | Average 96.0% |
| Chileans | 49.3 /100 | #176 | Average 96.0% |
| Immigrants | Korea | 49.2 /100 | #177 | Average 96.0% |
| Marshallese | 48.4 /100 | #178 | Average 96.0% |
| Immigrants | Iran | 47.8 /100 | #179 | Average 96.0% |
| Immigrants | Brazil | 46.8 /100 | #180 | Average 96.0% |
| Pakistanis | 44.5 /100 | #181 | Average 96.0% |
| Iraqis | 41.2 /100 | #182 | Average 96.0% |
| Immigrants | Spain | 38.8 /100 | #183 | Fair 96.0% |
| Sierra Leoneans | 37.5 /100 | #184 | Fair 96.0% |
| Brazilians | 37.3 /100 | #185 | Fair 96.0% |
| Immigrants | Iraq | 36.1 /100 | #186 | Fair 96.0% |
| Immigrants | Uganda | 36.0 /100 | #187 | Fair 96.0% |
| Immigrants | Egypt | 34.3 /100 | #188 | Fair 95.9% |
| Immigrants | Venezuela | 33.9 /100 | #189 | Fair 95.9% |
| Immigrants | Micronesia | 32.6 /100 | #190 | Fair 95.9% |
| Liberians | 32.5 /100 | #191 | Fair 95.9% |
| Panamanians | 32.3 /100 | #192 | Fair 95.9% |