Immigrants from Jordan vs Immigrants from Sri Lanka Disability Age Over 75
COMPARE
Immigrants from Jordan
Immigrants from Sri Lanka
Disability Age Over 75
Disability Age Over 75 Comparison
Immigrants from Jordan
Immigrants from Sri Lanka
46.2%
DISABILITY AGE OVER 75
98.7/ 100
METRIC RATING
84th/ 347
METRIC RANK
46.1%
DISABILITY AGE OVER 75
99.2/ 100
METRIC RATING
71st/ 347
METRIC RANK
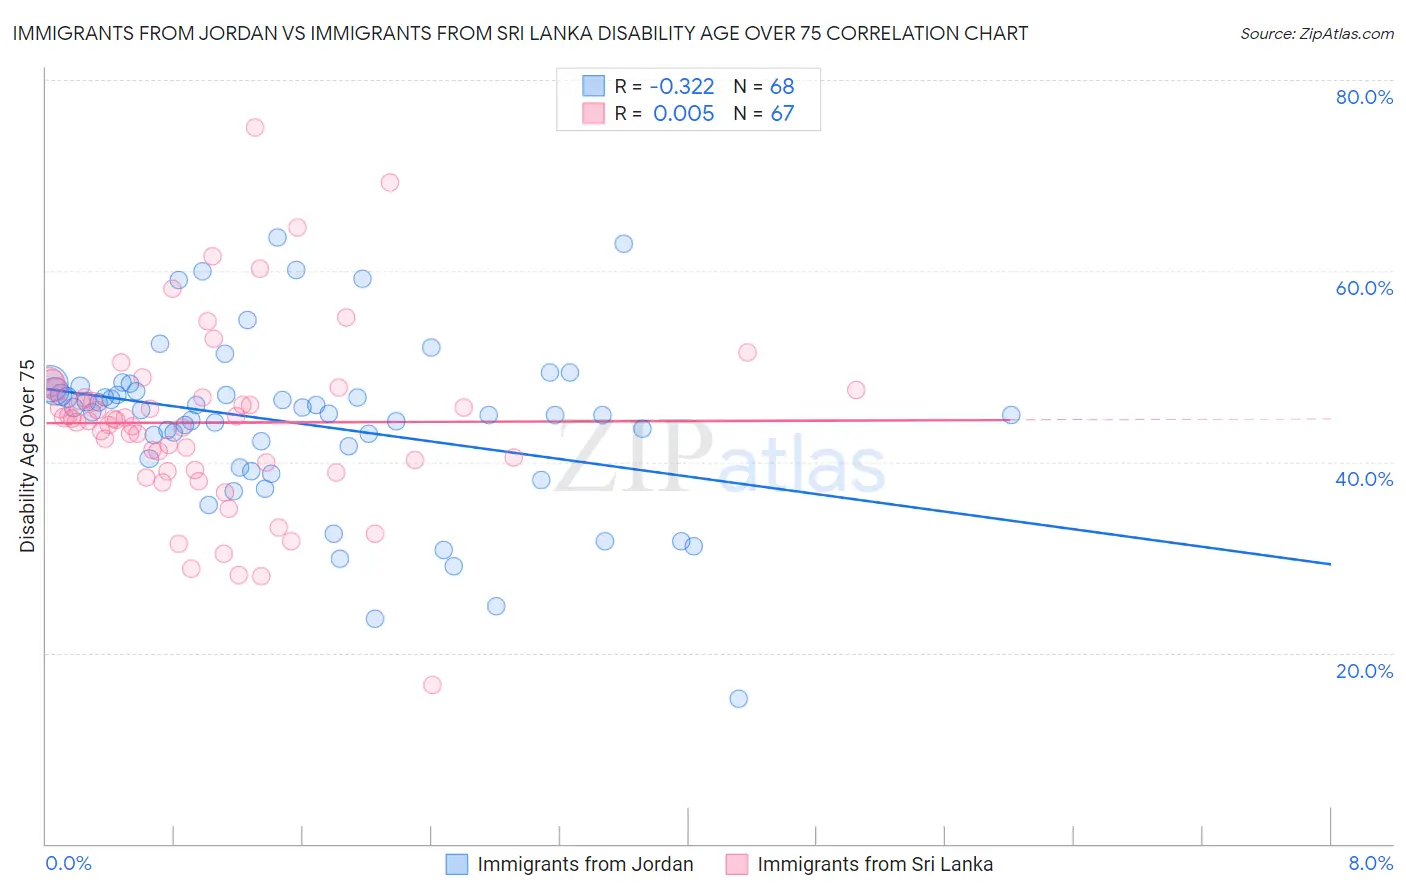
Immigrants from Jordan vs Immigrants from Sri Lanka Disability Age Over 75 Correlation Chart
The statistical analysis conducted on geographies consisting of 181,194,306 people shows a mild negative correlation between the proportion of Immigrants from Jordan and percentage of population with a disability over the age of 75 in the United States with a correlation coefficient (R) of -0.322 and weighted average of 46.2%. Similarly, the statistical analysis conducted on geographies consisting of 149,666,688 people shows no correlation between the proportion of Immigrants from Sri Lanka and percentage of population with a disability over the age of 75 in the United States with a correlation coefficient (R) of 0.005 and weighted average of 46.1%, a difference of 0.27%.
Disability Age Over 75 Correlation Summary
| Measurement | Immigrants from Jordan | Immigrants from Sri Lanka |
| Minimum | 15.2% | 16.7% |
| Maximum | 63.5% | 75.1% |
| Range | 48.4% | 58.4% |
| Mean | 43.9% | 44.1% |
| Median | 45.1% | 44.4% |
| Interquartile 25% (IQ1) | 39.8% | 39.1% |
| Interquartile 75% (IQ3) | 47.4% | 47.5% |
| Interquartile Range (IQR) | 7.5% | 8.4% |
| Standard Deviation (Sample) | 9.0% | 9.5% |
| Standard Deviation (Population) | 8.9% | 9.4% |
Demographics Similar to Immigrants from Jordan and Immigrants from Sri Lanka by Disability Age Over 75
In terms of disability age over 75, the demographic groups most similar to Immigrants from Jordan are Immigrants from Latvia (46.2%, a difference of 0.010%), Argentinean (46.2%, a difference of 0.010%), Immigrants from Southern Europe (46.2%, a difference of 0.020%), Romanian (46.2%, a difference of 0.020%), and Danish (46.2%, a difference of 0.020%). Similarly, the demographic groups most similar to Immigrants from Sri Lanka are Jordanian (46.1%, a difference of 0.030%), Immigrants from Hungary (46.1%, a difference of 0.030%), Cambodian (46.1%, a difference of 0.050%), Egyptian (46.1%, a difference of 0.10%), and Immigrants from Romania (46.0%, a difference of 0.13%).
| Demographics | Rating | Rank | Disability Age Over 75 |
| Immigrants | Spain | 99.4 /100 | #67 | Exceptional 46.0% |
| Immigrants | South Central Asia | 99.4 /100 | #68 | Exceptional 46.0% |
| Immigrants | Romania | 99.3 /100 | #69 | Exceptional 46.0% |
| Jordanians | 99.2 /100 | #70 | Exceptional 46.1% |
| Immigrants | Sri Lanka | 99.2 /100 | #71 | Exceptional 46.1% |
| Immigrants | Hungary | 99.1 /100 | #72 | Exceptional 46.1% |
| Cambodians | 99.1 /100 | #73 | Exceptional 46.1% |
| Egyptians | 99.0 /100 | #74 | Exceptional 46.1% |
| Serbians | 99.0 /100 | #75 | Exceptional 46.1% |
| Slavs | 98.9 /100 | #76 | Exceptional 46.1% |
| Immigrants | Eastern Asia | 98.9 /100 | #77 | Exceptional 46.2% |
| Immigrants | Western Europe | 98.8 /100 | #78 | Exceptional 46.2% |
| Swiss | 98.8 /100 | #79 | Exceptional 46.2% |
| Soviet Union | 98.8 /100 | #80 | Exceptional 46.2% |
| New Zealanders | 98.8 /100 | #81 | Exceptional 46.2% |
| Immigrants | Latvia | 98.7 /100 | #82 | Exceptional 46.2% |
| Argentineans | 98.7 /100 | #83 | Exceptional 46.2% |
| Immigrants | Jordan | 98.7 /100 | #84 | Exceptional 46.2% |
| Immigrants | Southern Europe | 98.6 /100 | #85 | Exceptional 46.2% |
| Romanians | 98.6 /100 | #86 | Exceptional 46.2% |
| Danes | 98.6 /100 | #87 | Exceptional 46.2% |