Immigrants from Jordan vs Immigrants Nursery School
COMPARE
Immigrants from Jordan
Immigrants
Nursery School
Nursery School Comparison
Immigrants from Jordan
Immigrants
98.0%
NURSERY SCHOOL
53.4/ 100
METRIC RATING
171st/ 347
METRIC RANK
97.2%
NURSERY SCHOOL
0.0/ 100
METRIC RATING
295th/ 347
METRIC RANK
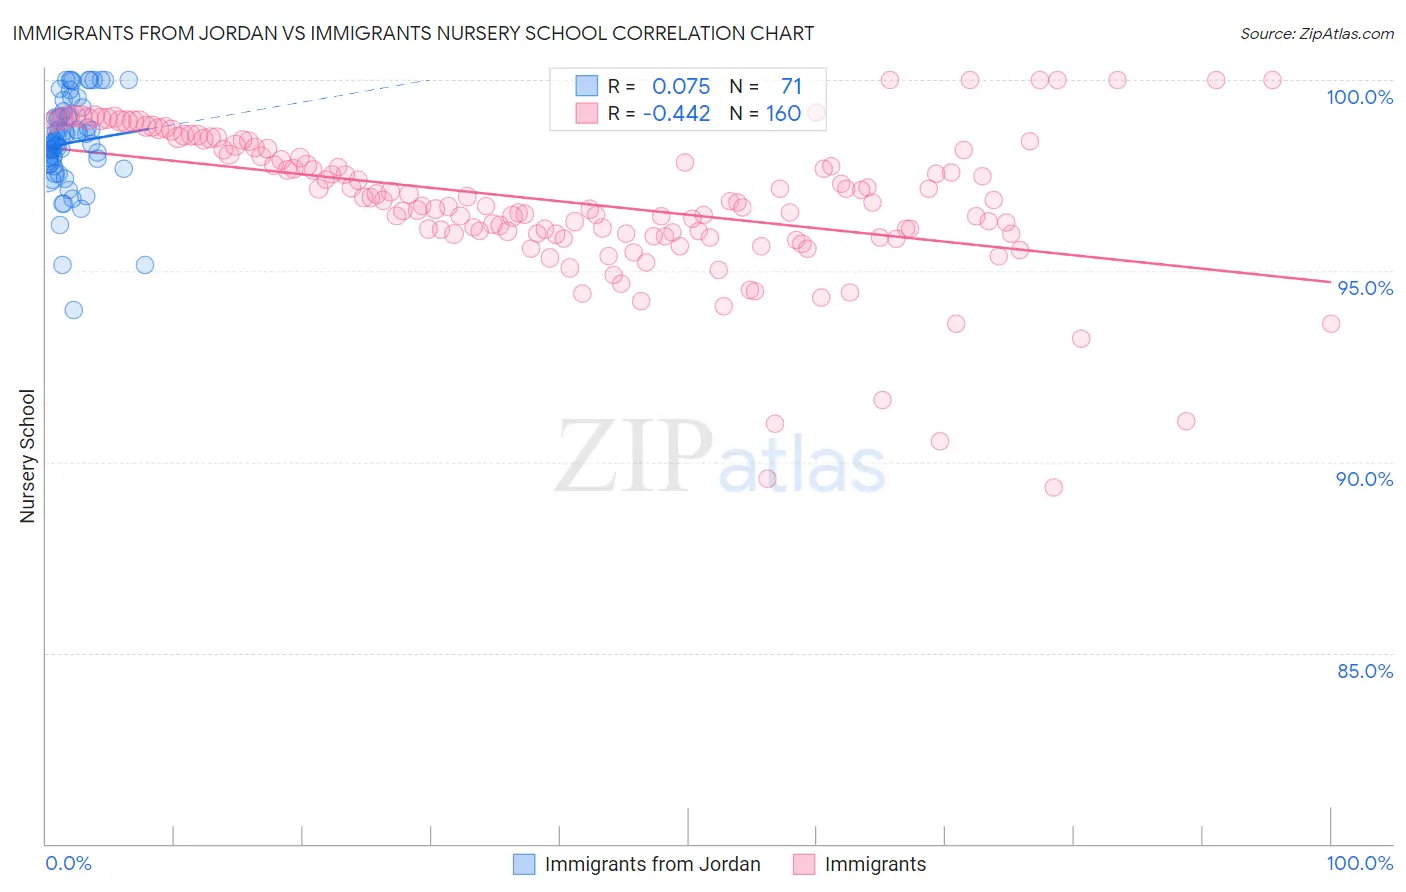
Immigrants from Jordan vs Immigrants Nursery School Correlation Chart
The statistical analysis conducted on geographies consisting of 181,269,915 people shows a slight positive correlation between the proportion of Immigrants from Jordan and percentage of population with at least nursery school education in the United States with a correlation coefficient (R) of 0.075 and weighted average of 98.0%. Similarly, the statistical analysis conducted on geographies consisting of 577,788,049 people shows a moderate negative correlation between the proportion of Immigrants and percentage of population with at least nursery school education in the United States with a correlation coefficient (R) of -0.442 and weighted average of 97.2%, a difference of 0.77%.
Nursery School Correlation Summary
| Measurement | Immigrants from Jordan | Immigrants |
| Minimum | 94.0% | 89.3% |
| Maximum | 100.0% | 100.0% |
| Range | 6.0% | 10.7% |
| Mean | 98.4% | 96.8% |
| Median | 98.4% | 96.8% |
| Interquartile 25% (IQ1) | 97.8% | 96.0% |
| Interquartile 75% (IQ3) | 99.1% | 98.2% |
| Interquartile Range (IQR) | 1.3% | 2.2% |
| Standard Deviation (Sample) | 1.2% | 1.9% |
| Standard Deviation (Population) | 1.2% | 1.9% |
Similar Demographics by Nursery School
Demographics Similar to Immigrants from Jordan by Nursery School
In terms of nursery school, the demographic groups most similar to Immigrants from Jordan are Immigrants from Korea (98.0%, a difference of 0.0%), Bermudan (98.0%, a difference of 0.0%), Ugandan (98.0%, a difference of 0.010%), Chilean (98.0%, a difference of 0.010%), and Spanish American (98.0%, a difference of 0.010%).
| Demographics | Rating | Rank | Nursery School |
| Ugandans | 56.4 /100 | #164 | Average 98.0% |
| Chileans | 56.4 /100 | #165 | Average 98.0% |
| Spanish Americans | 55.6 /100 | #166 | Average 98.0% |
| Immigrants | Spain | 55.6 /100 | #167 | Average 98.0% |
| Immigrants | Micronesia | 55.0 /100 | #168 | Average 98.0% |
| Immigrants | Korea | 53.8 /100 | #169 | Average 98.0% |
| Bermudans | 53.7 /100 | #170 | Average 98.0% |
| Immigrants | Jordan | 53.4 /100 | #171 | Average 98.0% |
| Immigrants | Brazil | 51.3 /100 | #172 | Average 98.0% |
| Kenyans | 50.2 /100 | #173 | Average 98.0% |
| Navajo | 50.0 /100 | #174 | Average 98.0% |
| Immigrants | Sri Lanka | 49.9 /100 | #175 | Average 98.0% |
| Immigrants | Venezuela | 49.8 /100 | #176 | Average 98.0% |
| Albanians | 48.9 /100 | #177 | Average 98.0% |
| Natives/Alaskans | 48.6 /100 | #178 | Average 98.0% |
Demographics Similar to Immigrants by Nursery School
In terms of nursery school, the demographic groups most similar to Immigrants are Immigrants from Grenada (97.3%, a difference of 0.010%), Immigrants from Eritrea (97.2%, a difference of 0.010%), Malaysian (97.3%, a difference of 0.020%), Houma (97.3%, a difference of 0.030%), and British West Indian (97.3%, a difference of 0.050%).
| Demographics | Rating | Rank | Nursery School |
| Immigrants | Thailand | 0.0 /100 | #288 | Tragic 97.3% |
| Immigrants | St. Vincent and the Grenadines | 0.0 /100 | #289 | Tragic 97.3% |
| Immigrants | Afghanistan | 0.0 /100 | #290 | Tragic 97.3% |
| British West Indians | 0.0 /100 | #291 | Tragic 97.3% |
| Houma | 0.0 /100 | #292 | Tragic 97.3% |
| Malaysians | 0.0 /100 | #293 | Tragic 97.3% |
| Immigrants | Grenada | 0.0 /100 | #294 | Tragic 97.3% |
| Immigrants | Immigrants | 0.0 /100 | #295 | Tragic 97.2% |
| Immigrants | Eritrea | 0.0 /100 | #296 | Tragic 97.2% |
| Immigrants | Cuba | 0.0 /100 | #297 | Tragic 97.2% |
| Central American Indians | 0.0 /100 | #298 | Tragic 97.2% |
| Immigrants | Dominica | 0.0 /100 | #299 | Tragic 97.2% |
| Haitians | 0.0 /100 | #300 | Tragic 97.2% |
| Immigrants | South Eastern Asia | 0.0 /100 | #301 | Tragic 97.1% |
| Immigrants | Caribbean | 0.0 /100 | #302 | Tragic 97.1% |