Nepalese vs Lumbee Professional Degree
COMPARE
Nepalese
Lumbee
Professional Degree
Professional Degree Comparison
Nepalese
Lumbee
3.2%
PROFESSIONAL DEGREE
0.1/ 100
METRIC RATING
317th/ 347
METRIC RANK
2.5%
PROFESSIONAL DEGREE
0.0/ 100
METRIC RATING
346th/ 347
METRIC RANK
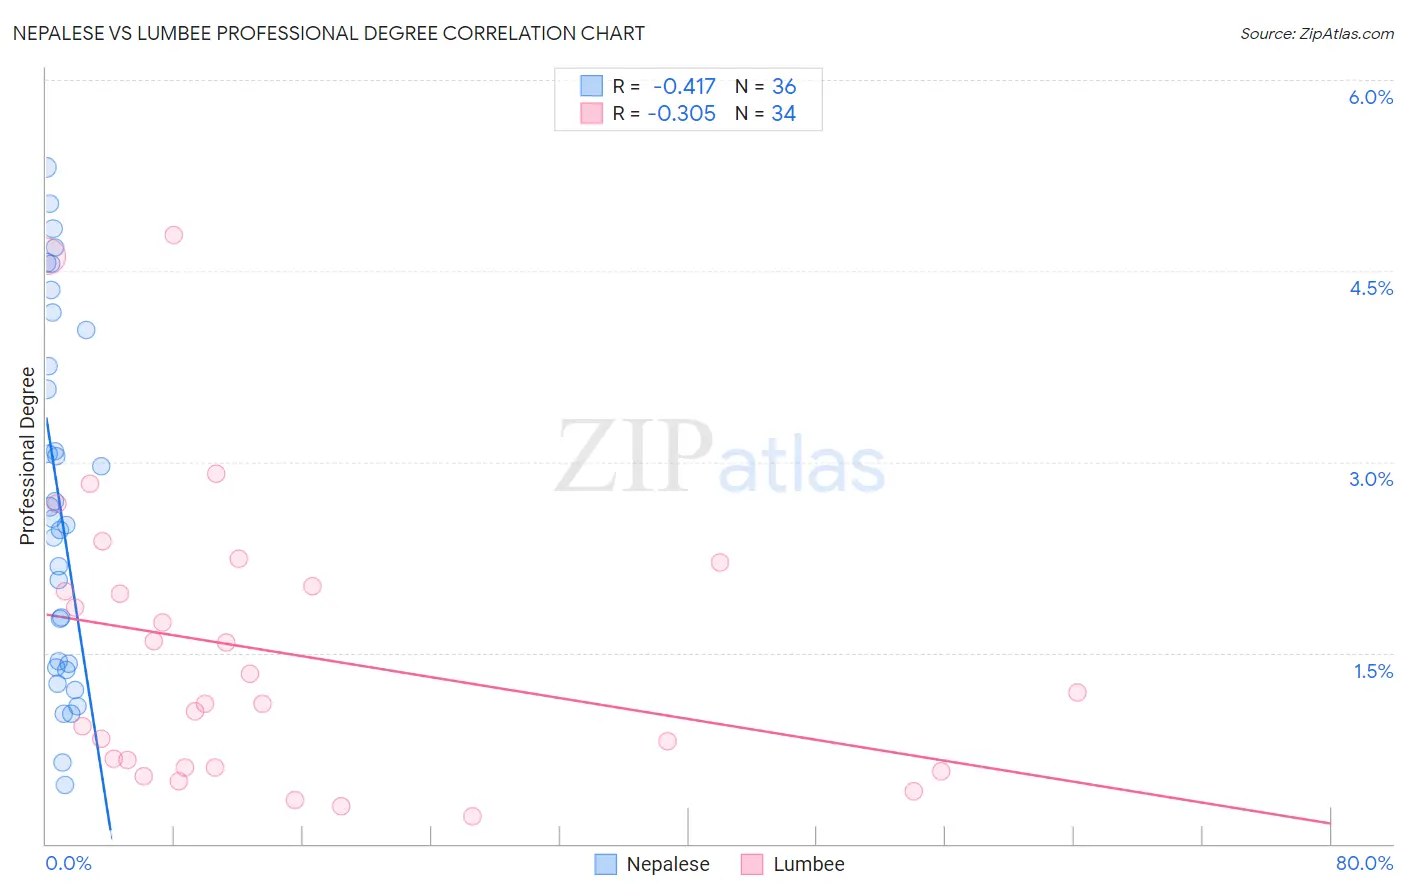
Nepalese vs Lumbee Professional Degree Correlation Chart
The statistical analysis conducted on geographies consisting of 24,504,313 people shows a moderate negative correlation between the proportion of Nepalese and percentage of population with at least professional degree education in the United States with a correlation coefficient (R) of -0.417 and weighted average of 3.2%. Similarly, the statistical analysis conducted on geographies consisting of 92,157,121 people shows a mild negative correlation between the proportion of Lumbee and percentage of population with at least professional degree education in the United States with a correlation coefficient (R) of -0.305 and weighted average of 2.5%, a difference of 31.5%.
Professional Degree Correlation Summary
| Measurement | Nepalese | Lumbee |
| Minimum | 0.47% | 0.22% |
| Maximum | 5.3% | 4.8% |
| Range | 4.9% | 4.6% |
| Mean | 2.7% | 1.5% |
| Median | 2.5% | 1.1% |
| Interquartile 25% (IQ1) | 1.4% | 0.60% |
| Interquartile 75% (IQ3) | 3.9% | 2.0% |
| Interquartile Range (IQR) | 2.5% | 1.4% |
| Standard Deviation (Sample) | 1.4% | 1.1% |
| Standard Deviation (Population) | 1.4% | 1.1% |
Similar Demographics by Professional Degree
Demographics Similar to Nepalese by Professional Degree
In terms of professional degree, the demographic groups most similar to Nepalese are Immigrants from Micronesia (3.2%, a difference of 0.030%), Puerto Rican (3.2%, a difference of 0.21%), Immigrants from Laos (3.2%, a difference of 0.22%), Choctaw (3.2%, a difference of 0.27%), and Mexican American Indian (3.3%, a difference of 0.90%).
| Demographics | Rating | Rank | Professional Degree |
| Immigrants | Latin America | 0.1 /100 | #310 | Tragic 3.3% |
| Cherokee | 0.1 /100 | #311 | Tragic 3.3% |
| Sioux | 0.1 /100 | #312 | Tragic 3.3% |
| Yuman | 0.1 /100 | #313 | Tragic 3.3% |
| Mexican American Indians | 0.1 /100 | #314 | Tragic 3.3% |
| Immigrants | Laos | 0.1 /100 | #315 | Tragic 3.2% |
| Puerto Ricans | 0.1 /100 | #316 | Tragic 3.2% |
| Nepalese | 0.1 /100 | #317 | Tragic 3.2% |
| Immigrants | Micronesia | 0.1 /100 | #318 | Tragic 3.2% |
| Choctaw | 0.1 /100 | #319 | Tragic 3.2% |
| Seminole | 0.1 /100 | #320 | Tragic 3.2% |
| Tsimshian | 0.0 /100 | #321 | Tragic 3.2% |
| Hispanics or Latinos | 0.0 /100 | #322 | Tragic 3.2% |
| Inupiat | 0.0 /100 | #323 | Tragic 3.2% |
| Crow | 0.0 /100 | #324 | Tragic 3.2% |
Demographics Similar to Lumbee by Professional Degree
In terms of professional degree, the demographic groups most similar to Lumbee are Immigrants from Mexico (2.6%, a difference of 7.4%), Spanish American Indian (2.7%, a difference of 7.7%), Houma (2.2%, a difference of 11.1%), Mexican (2.7%, a difference of 11.7%), and Immigrants from the Azores (2.8%, a difference of 14.8%).
| Demographics | Rating | Rank | Professional Degree |
| Puget Sound Salish | 0.0 /100 | #333 | Tragic 3.1% |
| Pennsylvania Germans | 0.0 /100 | #334 | Tragic 3.0% |
| Natives/Alaskans | 0.0 /100 | #335 | Tragic 3.0% |
| Fijians | 0.0 /100 | #336 | Tragic 2.9% |
| Arapaho | 0.0 /100 | #337 | Tragic 2.9% |
| Navajo | 0.0 /100 | #338 | Tragic 2.9% |
| Immigrants | Central America | 0.0 /100 | #339 | Tragic 2.9% |
| Yup'ik | 0.0 /100 | #340 | Tragic 2.9% |
| Tohono O'odham | 0.0 /100 | #341 | Tragic 2.8% |
| Immigrants | Azores | 0.0 /100 | #342 | Tragic 2.8% |
| Mexicans | 0.0 /100 | #343 | Tragic 2.7% |
| Spanish American Indians | 0.0 /100 | #344 | Tragic 2.7% |
| Immigrants | Mexico | 0.0 /100 | #345 | Tragic 2.6% |
| Lumbee | 0.0 /100 | #346 | Tragic 2.5% |
| Houma | 0.0 /100 | #347 | Tragic 2.2% |