Immigrants from Japan vs Immigrants from Western Asia Professional Degree
COMPARE
Immigrants from Japan
Immigrants from Western Asia
Professional Degree
Professional Degree Comparison
Immigrants from Japan
Immigrants from Western Asia
6.4%
PROFESSIONAL DEGREE
100.0/ 100
METRIC RATING
22nd/ 347
METRIC RANK
5.4%
PROFESSIONAL DEGREE
99.8/ 100
METRIC RATING
71st/ 347
METRIC RANK
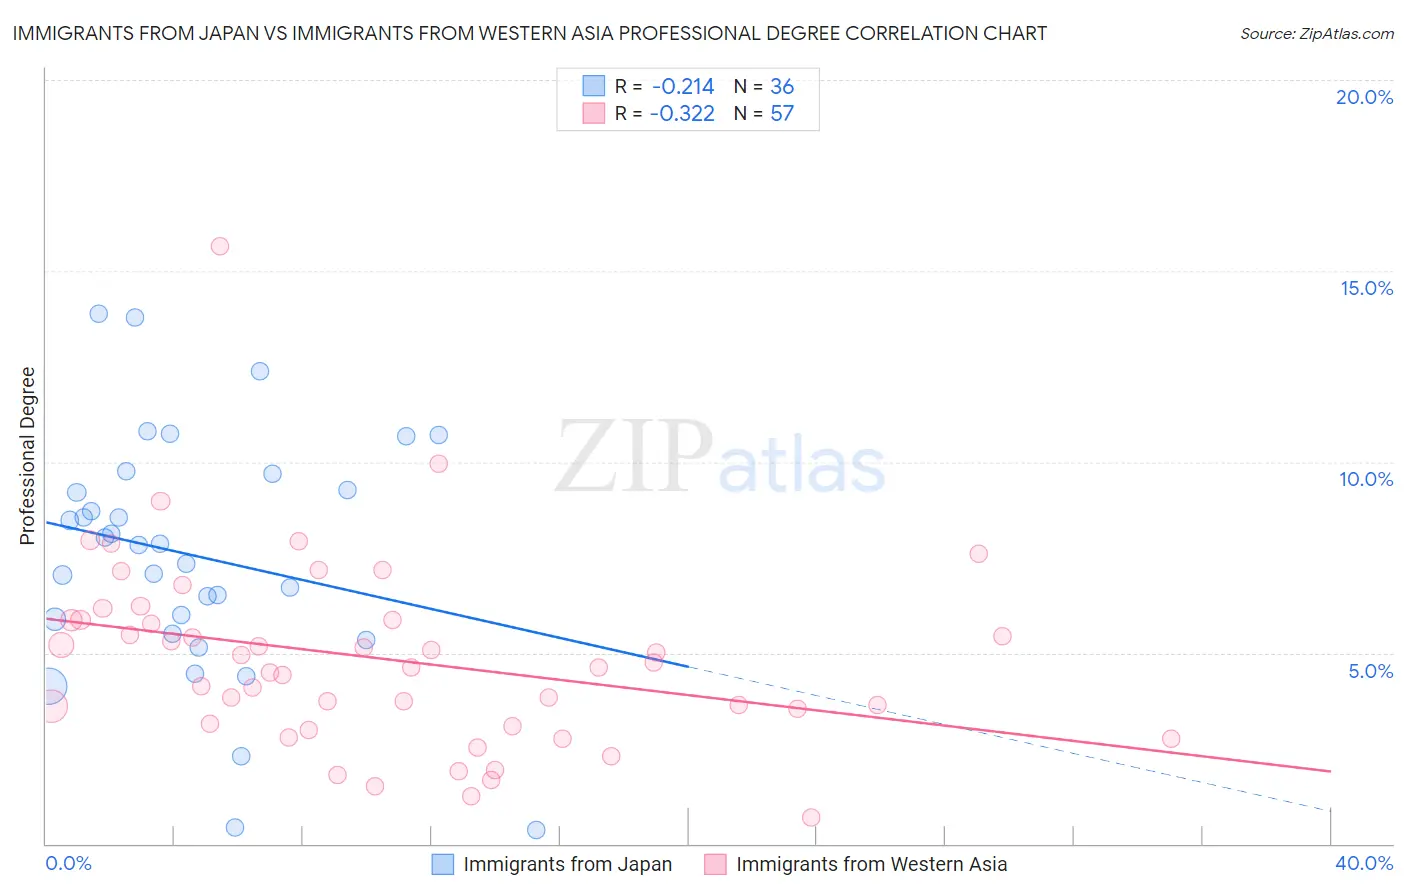
Immigrants from Japan vs Immigrants from Western Asia Professional Degree Correlation Chart
The statistical analysis conducted on geographies consisting of 339,733,444 people shows a weak negative correlation between the proportion of Immigrants from Japan and percentage of population with at least professional degree education in the United States with a correlation coefficient (R) of -0.214 and weighted average of 6.4%. Similarly, the statistical analysis conducted on geographies consisting of 403,868,924 people shows a mild negative correlation between the proportion of Immigrants from Western Asia and percentage of population with at least professional degree education in the United States with a correlation coefficient (R) of -0.322 and weighted average of 5.4%, a difference of 17.7%.
Professional Degree Correlation Summary
| Measurement | Immigrants from Japan | Immigrants from Western Asia |
| Minimum | 0.36% | 0.70% |
| Maximum | 13.9% | 15.7% |
| Range | 13.5% | 14.9% |
| Mean | 7.6% | 4.8% |
| Median | 7.8% | 4.6% |
| Interquartile 25% (IQ1) | 5.7% | 3.1% |
| Interquartile 75% (IQ3) | 9.5% | 5.9% |
| Interquartile Range (IQR) | 3.8% | 2.8% |
| Standard Deviation (Sample) | 3.2% | 2.5% |
| Standard Deviation (Population) | 3.1% | 2.5% |
Similar Demographics by Professional Degree
Demographics Similar to Immigrants from Japan by Professional Degree
In terms of professional degree, the demographic groups most similar to Immigrants from Japan are Russian (6.3%, a difference of 0.48%), Immigrants from Spain (6.3%, a difference of 0.51%), Immigrants from Hong Kong (6.4%, a difference of 0.73%), Immigrants from Denmark (6.4%, a difference of 0.95%), and Immigrants from Ireland (6.3%, a difference of 1.0%).
| Demographics | Rating | Rank | Professional Degree |
| Immigrants | China | 100.0 /100 | #15 | Exceptional 6.7% |
| Immigrants | Sweden | 100.0 /100 | #16 | Exceptional 6.7% |
| Immigrants | Eastern Asia | 100.0 /100 | #17 | Exceptional 6.6% |
| Soviet Union | 100.0 /100 | #18 | Exceptional 6.6% |
| Indians (Asian) | 100.0 /100 | #19 | Exceptional 6.5% |
| Immigrants | Denmark | 100.0 /100 | #20 | Exceptional 6.4% |
| Immigrants | Hong Kong | 100.0 /100 | #21 | Exceptional 6.4% |
| Immigrants | Japan | 100.0 /100 | #22 | Exceptional 6.4% |
| Russians | 100.0 /100 | #23 | Exceptional 6.3% |
| Immigrants | Spain | 100.0 /100 | #24 | Exceptional 6.3% |
| Immigrants | Ireland | 100.0 /100 | #25 | Exceptional 6.3% |
| Latvians | 100.0 /100 | #26 | Exceptional 6.2% |
| Immigrants | Northern Europe | 100.0 /100 | #27 | Exceptional 6.2% |
| Turks | 100.0 /100 | #28 | Exceptional 6.2% |
| Immigrants | Sri Lanka | 100.0 /100 | #29 | Exceptional 6.2% |
Demographics Similar to Immigrants from Western Asia by Professional Degree
In terms of professional degree, the demographic groups most similar to Immigrants from Western Asia are Lithuanian (5.4%, a difference of 0.48%), Immigrants from Romania (5.4%, a difference of 0.58%), Bhutanese (5.4%, a difference of 0.59%), Immigrants from Hungary (5.5%, a difference of 0.92%), and Ethiopian (5.4%, a difference of 0.96%).
| Demographics | Rating | Rank | Professional Degree |
| Immigrants | Asia | 99.9 /100 | #64 | Exceptional 5.5% |
| Immigrants | Bolivia | 99.9 /100 | #65 | Exceptional 5.5% |
| Immigrants | Kazakhstan | 99.9 /100 | #66 | Exceptional 5.5% |
| Immigrants | Bulgaria | 99.9 /100 | #67 | Exceptional 5.5% |
| Immigrants | Lebanon | 99.9 /100 | #68 | Exceptional 5.5% |
| Immigrants | Hungary | 99.9 /100 | #69 | Exceptional 5.5% |
| Bhutanese | 99.8 /100 | #70 | Exceptional 5.4% |
| Immigrants | Western Asia | 99.8 /100 | #71 | Exceptional 5.4% |
| Lithuanians | 99.8 /100 | #72 | Exceptional 5.4% |
| Immigrants | Romania | 99.8 /100 | #73 | Exceptional 5.4% |
| Ethiopians | 99.7 /100 | #74 | Exceptional 5.4% |
| Immigrants | Indonesia | 99.7 /100 | #75 | Exceptional 5.3% |
| Immigrants | Canada | 99.7 /100 | #76 | Exceptional 5.3% |
| Immigrants | Ethiopia | 99.7 /100 | #77 | Exceptional 5.3% |
| Armenians | 99.7 /100 | #78 | Exceptional 5.3% |