Immigrants from Jamaica vs Yup'ik 1st Grade
COMPARE
Immigrants from Jamaica
Yup'ik
1st Grade
1st Grade Comparison
Immigrants from Jamaica
Yup'ik
97.5%
1ST GRADE
0.2/ 100
METRIC RATING
270th/ 347
METRIC RANK
99.2%
1ST GRADE
100.0/ 100
METRIC RATING
2nd/ 347
METRIC RANK
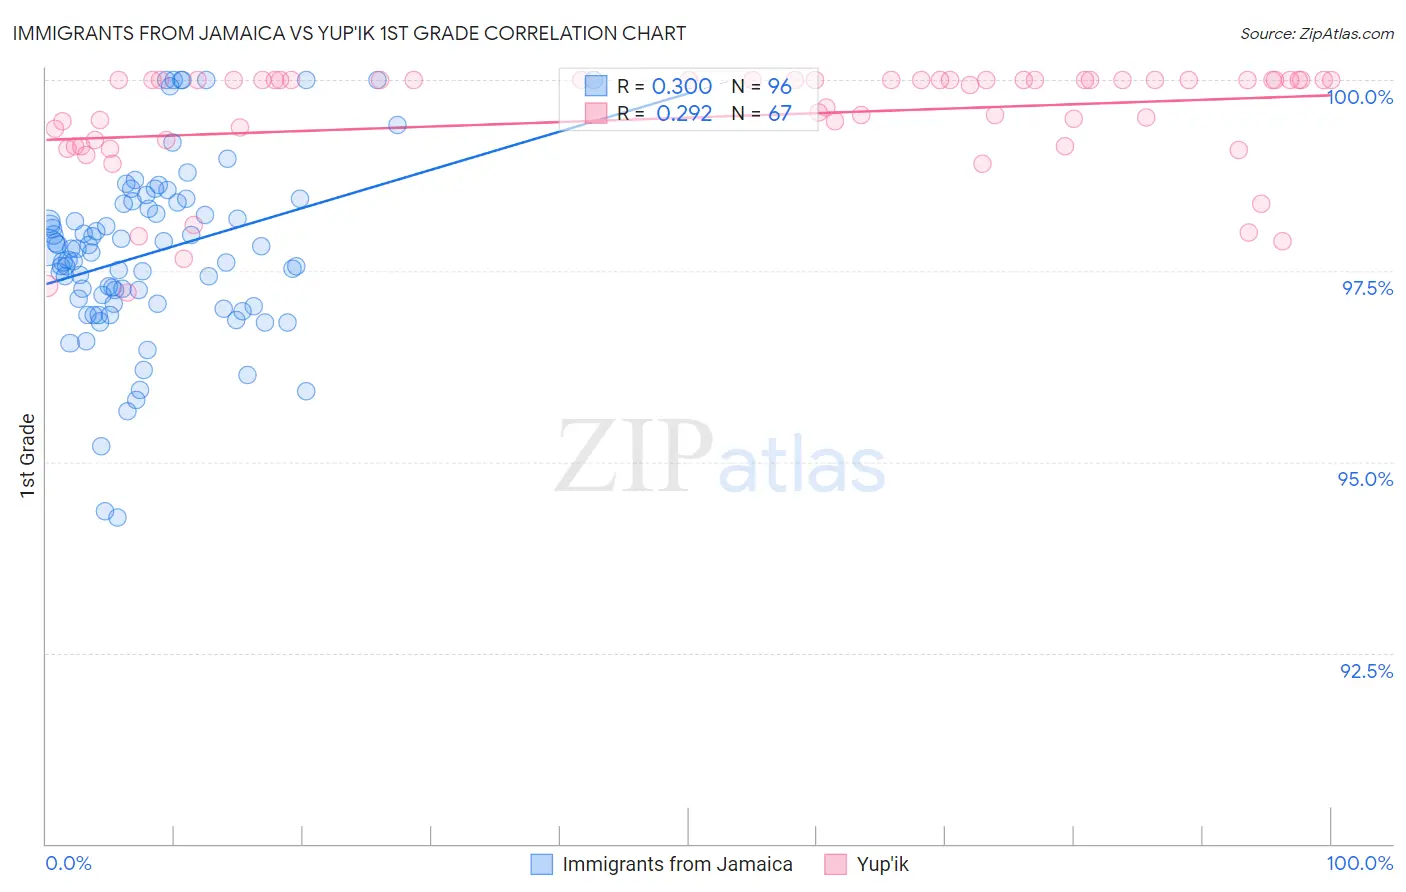
Immigrants from Jamaica vs Yup'ik 1st Grade Correlation Chart
The statistical analysis conducted on geographies consisting of 301,830,081 people shows a mild positive correlation between the proportion of Immigrants from Jamaica and percentage of population with at least 1st grade education in the United States with a correlation coefficient (R) of 0.300 and weighted average of 97.5%. Similarly, the statistical analysis conducted on geographies consisting of 39,964,464 people shows a weak positive correlation between the proportion of Yup'ik and percentage of population with at least 1st grade education in the United States with a correlation coefficient (R) of 0.292 and weighted average of 99.2%, a difference of 1.8%.
1st Grade Correlation Summary
| Measurement | Immigrants from Jamaica | Yup'ik |
| Minimum | 94.3% | 97.2% |
| Maximum | 100.0% | 100.0% |
| Range | 5.7% | 2.8% |
| Mean | 97.7% | 99.5% |
| Median | 97.8% | 100.0% |
| Interquartile 25% (IQ1) | 97.1% | 99.1% |
| Interquartile 75% (IQ3) | 98.4% | 100.0% |
| Interquartile Range (IQR) | 1.3% | 0.86% |
| Standard Deviation (Sample) | 1.2% | 0.73% |
| Standard Deviation (Population) | 1.2% | 0.72% |
Similar Demographics by 1st Grade
Demographics Similar to Immigrants from Jamaica by 1st Grade
In terms of 1st grade, the demographic groups most similar to Immigrants from Jamaica are Immigrants from Nigeria (97.5%, a difference of 0.020%), West Indian (97.5%, a difference of 0.020%), Immigrants from Cameroon (97.4%, a difference of 0.020%), Immigrants from Peru (97.4%, a difference of 0.020%), and Immigrants from Bolivia (97.4%, a difference of 0.020%).
| Demographics | Rating | Rank | 1st Grade |
| Immigrants | South America | 0.4 /100 | #263 | Tragic 97.5% |
| Taiwanese | 0.4 /100 | #264 | Tragic 97.5% |
| Cubans | 0.3 /100 | #265 | Tragic 97.5% |
| Immigrants | Liberia | 0.3 /100 | #266 | Tragic 97.5% |
| Immigrants | Sierra Leone | 0.3 /100 | #267 | Tragic 97.5% |
| Immigrants | Nigeria | 0.3 /100 | #268 | Tragic 97.5% |
| West Indians | 0.3 /100 | #269 | Tragic 97.5% |
| Immigrants | Jamaica | 0.2 /100 | #270 | Tragic 97.5% |
| Immigrants | Cameroon | 0.2 /100 | #271 | Tragic 97.4% |
| Immigrants | Peru | 0.2 /100 | #272 | Tragic 97.4% |
| Immigrants | Bolivia | 0.2 /100 | #273 | Tragic 97.4% |
| Ghanaians | 0.1 /100 | #274 | Tragic 97.4% |
| Immigrants | China | 0.1 /100 | #275 | Tragic 97.4% |
| Immigrants | Philippines | 0.1 /100 | #276 | Tragic 97.4% |
| Immigrants | Western Africa | 0.1 /100 | #277 | Tragic 97.4% |
Demographics Similar to Yup'ik by 1st Grade
In terms of 1st grade, the demographic groups most similar to Yup'ik are Inupiat (98.9%, a difference of 0.33%), Welsh (98.9%, a difference of 0.34%), Tsimshian (98.8%, a difference of 0.37%), Alaskan Athabascan (98.8%, a difference of 0.42%), and Crow (99.6%, a difference of 0.46%).
| Demographics | Rating | Rank | 1st Grade |
| Crow | 100.0 /100 | #1 | Exceptional 99.6% |
| Yup'ik | 100.0 /100 | #2 | Exceptional 99.2% |
| Inupiat | 100.0 /100 | #3 | Exceptional 98.9% |
| Welsh | 100.0 /100 | #4 | Exceptional 98.9% |
| Tsimshian | 100.0 /100 | #5 | Exceptional 98.8% |
| Alaskan Athabascans | 100.0 /100 | #6 | Exceptional 98.8% |
| Alaska Natives | 100.0 /100 | #7 | Exceptional 98.7% |
| Norwegians | 100.0 /100 | #8 | Exceptional 98.7% |
| Slovaks | 100.0 /100 | #9 | Exceptional 98.7% |
| Germans | 100.0 /100 | #10 | Exceptional 98.7% |
| Tlingit-Haida | 100.0 /100 | #11 | Exceptional 98.7% |
| Slovenes | 100.0 /100 | #12 | Exceptional 98.7% |
| Carpatho Rusyns | 100.0 /100 | #13 | Exceptional 98.6% |
| English | 100.0 /100 | #14 | Exceptional 98.6% |
| Swedes | 100.0 /100 | #15 | Exceptional 98.6% |