Immigrants from Jamaica vs Assyrian/Chaldean/Syriac 9th Grade
COMPARE
Immigrants from Jamaica
Assyrian/Chaldean/Syriac
9th Grade
9th Grade Comparison
Immigrants from Jamaica
Assyrians/Chaldeans/Syriacs
93.9%
9TH GRADE
0.4/ 100
METRIC RATING
262nd/ 347
METRIC RANK
94.7%
9TH GRADE
32.0/ 100
METRIC RATING
191st/ 347
METRIC RANK
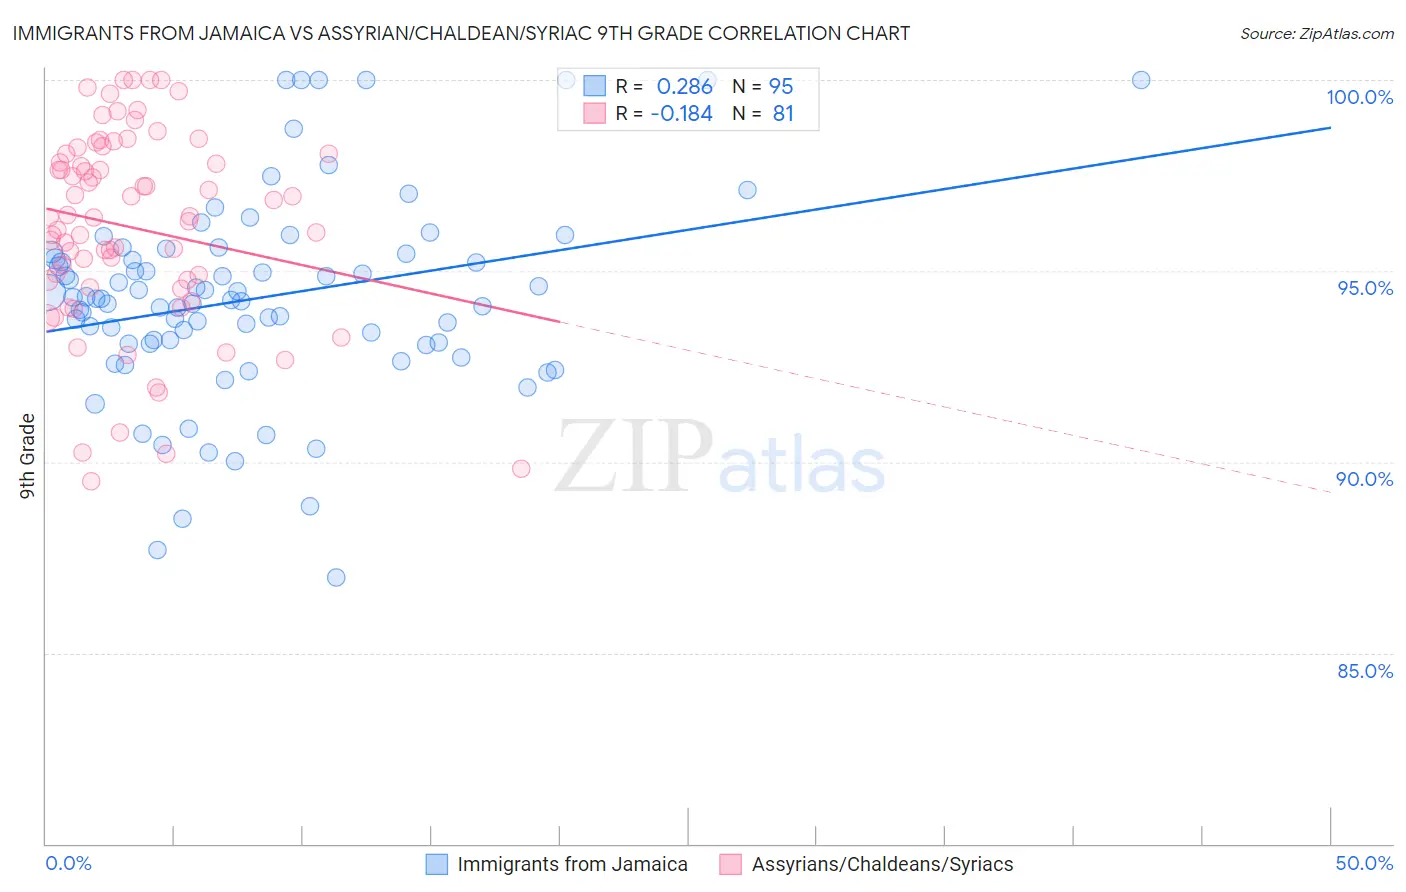
Immigrants from Jamaica vs Assyrian/Chaldean/Syriac 9th Grade Correlation Chart
The statistical analysis conducted on geographies consisting of 301,829,550 people shows a weak positive correlation between the proportion of Immigrants from Jamaica and percentage of population with at least 9th grade education in the United States with a correlation coefficient (R) of 0.286 and weighted average of 93.9%. Similarly, the statistical analysis conducted on geographies consisting of 110,318,304 people shows a poor negative correlation between the proportion of Assyrians/Chaldeans/Syriacs and percentage of population with at least 9th grade education in the United States with a correlation coefficient (R) of -0.184 and weighted average of 94.7%, a difference of 0.89%.
9th Grade Correlation Summary
| Measurement | Immigrants from Jamaica | Assyrian/Chaldean/Syriac |
| Minimum | 87.0% | 89.5% |
| Maximum | 100.0% | 100.0% |
| Range | 13.0% | 10.5% |
| Mean | 94.3% | 96.1% |
| Median | 94.3% | 96.4% |
| Interquartile 25% (IQ1) | 93.1% | 94.7% |
| Interquartile 75% (IQ3) | 95.5% | 98.1% |
| Interquartile Range (IQR) | 2.4% | 3.4% |
| Standard Deviation (Sample) | 2.6% | 2.6% |
| Standard Deviation (Population) | 2.6% | 2.5% |
Similar Demographics by 9th Grade
Demographics Similar to Immigrants from Jamaica by 9th Grade
In terms of 9th grade, the demographic groups most similar to Immigrants from Jamaica are Immigrants from Uzbekistan (93.9%, a difference of 0.010%), Immigrants from Congo (93.9%, a difference of 0.010%), Native/Alaskan (93.9%, a difference of 0.010%), Pima (93.9%, a difference of 0.020%), and South American (93.9%, a difference of 0.020%).
| Demographics | Rating | Rank | 9th Grade |
| Immigrants | Nigeria | 0.6 /100 | #255 | Tragic 94.0% |
| Immigrants | Afghanistan | 0.5 /100 | #256 | Tragic 94.0% |
| Immigrants | Costa Rica | 0.5 /100 | #257 | Tragic 94.0% |
| Immigrants | Thailand | 0.5 /100 | #258 | Tragic 93.9% |
| Ghanaians | 0.5 /100 | #259 | Tragic 93.9% |
| Pima | 0.4 /100 | #260 | Tragic 93.9% |
| South Americans | 0.4 /100 | #261 | Tragic 93.9% |
| Immigrants | Jamaica | 0.4 /100 | #262 | Tragic 93.9% |
| Immigrants | Uzbekistan | 0.4 /100 | #263 | Tragic 93.9% |
| Immigrants | Congo | 0.4 /100 | #264 | Tragic 93.9% |
| Natives/Alaskans | 0.4 /100 | #265 | Tragic 93.9% |
| Navajo | 0.3 /100 | #266 | Tragic 93.9% |
| Armenians | 0.3 /100 | #267 | Tragic 93.9% |
| Immigrants | Bolivia | 0.3 /100 | #268 | Tragic 93.9% |
| Immigrants | Uruguay | 0.2 /100 | #269 | Tragic 93.8% |
Demographics Similar to Assyrians/Chaldeans/Syriacs by 9th Grade
In terms of 9th grade, the demographic groups most similar to Assyrians/Chaldeans/Syriacs are Sudanese (94.7%, a difference of 0.010%), Immigrants from Northern Africa (94.7%, a difference of 0.010%), Immigrants from Albania (94.8%, a difference of 0.020%), Immigrants from Argentina (94.8%, a difference of 0.020%), and Paraguayan (94.7%, a difference of 0.020%).
| Demographics | Rating | Rank | 9th Grade |
| Argentineans | 37.6 /100 | #184 | Fair 94.8% |
| Liberians | 37.4 /100 | #185 | Fair 94.8% |
| Hopi | 37.1 /100 | #186 | Fair 94.8% |
| Guamanians/Chamorros | 35.5 /100 | #187 | Fair 94.8% |
| Immigrants | Albania | 34.5 /100 | #188 | Fair 94.8% |
| Immigrants | Argentina | 34.4 /100 | #189 | Fair 94.8% |
| Sudanese | 32.7 /100 | #190 | Fair 94.7% |
| Assyrians/Chaldeans/Syriacs | 32.0 /100 | #191 | Fair 94.7% |
| Immigrants | Northern Africa | 30.7 /100 | #192 | Fair 94.7% |
| Paraguayans | 30.1 /100 | #193 | Fair 94.7% |
| Panamanians | 29.0 /100 | #194 | Fair 94.7% |
| Marshallese | 27.9 /100 | #195 | Fair 94.7% |
| Immigrants | Lebanon | 27.2 /100 | #196 | Fair 94.7% |
| Immigrants | Micronesia | 24.7 /100 | #197 | Fair 94.7% |
| Hawaiians | 22.7 /100 | #198 | Fair 94.7% |