Immigrants from Israel vs Yaqui Master's Degree
COMPARE
Immigrants from Israel
Yaqui
Master's Degree
Master's Degree Comparison
Immigrants from Israel
Yaqui
22.6%
MASTER'S DEGREE
100.0/ 100
METRIC RATING
3rd/ 347
METRIC RANK
11.0%
MASTER'S DEGREE
0.0/ 100
METRIC RATING
313th/ 347
METRIC RANK
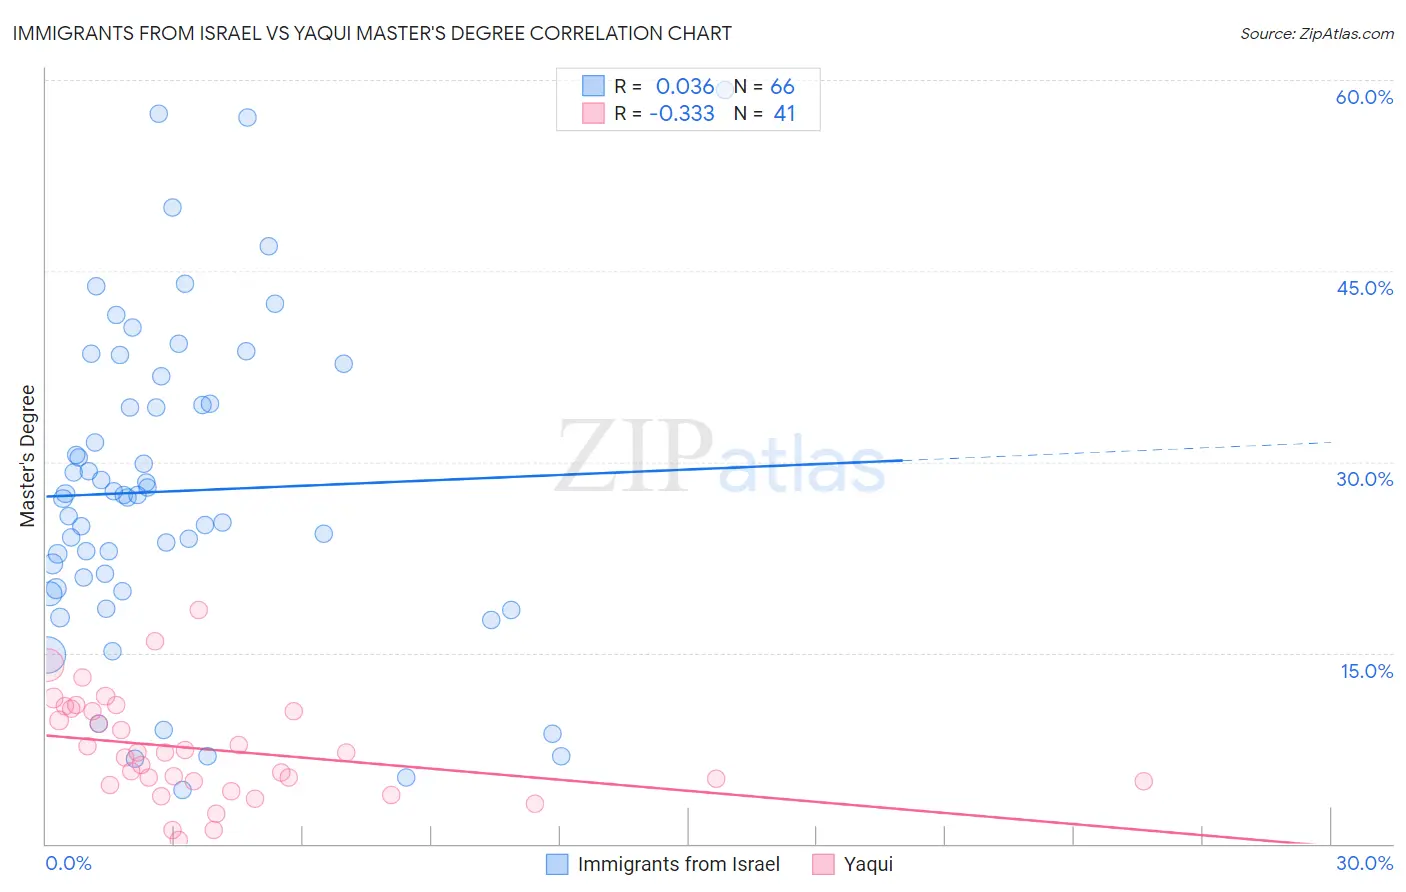
Immigrants from Israel vs Yaqui Master's Degree Correlation Chart
The statistical analysis conducted on geographies consisting of 210,015,600 people shows no correlation between the proportion of Immigrants from Israel and percentage of population with at least master's degree education in the United States with a correlation coefficient (R) of 0.036 and weighted average of 22.6%. Similarly, the statistical analysis conducted on geographies consisting of 107,722,920 people shows a mild negative correlation between the proportion of Yaqui and percentage of population with at least master's degree education in the United States with a correlation coefficient (R) of -0.333 and weighted average of 11.0%, a difference of 105.6%.
Master's Degree Correlation Summary
| Measurement | Immigrants from Israel | Yaqui |
| Minimum | 4.2% | 0.29% |
| Maximum | 59.3% | 18.4% |
| Range | 55.1% | 18.1% |
| Mean | 27.7% | 7.4% |
| Median | 27.3% | 7.1% |
| Interquartile 25% (IQ1) | 20.0% | 4.7% |
| Interquartile 75% (IQ3) | 34.6% | 10.5% |
| Interquartile Range (IQR) | 14.6% | 5.8% |
| Standard Deviation (Sample) | 12.5% | 4.0% |
| Standard Deviation (Population) | 12.4% | 4.0% |
Similar Demographics by Master's Degree
Demographics Similar to Immigrants from Israel by Master's Degree
In terms of master's degree, the demographic groups most similar to Immigrants from Israel are Okinawan (22.6%, a difference of 0.0%), Immigrants from Taiwan (22.5%, a difference of 0.80%), Immigrants from India (22.3%, a difference of 1.5%), Iranian (22.3%, a difference of 1.7%), and Filipino (23.4%, a difference of 3.4%).
| Demographics | Rating | Rank | Master's Degree |
| Immigrants | Singapore | 100.0 /100 | #1 | Exceptional 23.4% |
| Filipinos | 100.0 /100 | #2 | Exceptional 23.4% |
| Immigrants | Israel | 100.0 /100 | #3 | Exceptional 22.6% |
| Okinawans | 100.0 /100 | #4 | Exceptional 22.6% |
| Immigrants | Taiwan | 100.0 /100 | #5 | Exceptional 22.5% |
| Immigrants | India | 100.0 /100 | #6 | Exceptional 22.3% |
| Iranians | 100.0 /100 | #7 | Exceptional 22.3% |
| Cypriots | 100.0 /100 | #8 | Exceptional 21.8% |
| Thais | 100.0 /100 | #9 | Exceptional 21.7% |
| Immigrants | Iran | 100.0 /100 | #10 | Exceptional 21.6% |
| Immigrants | China | 100.0 /100 | #11 | Exceptional 21.2% |
| Eastern Europeans | 100.0 /100 | #12 | Exceptional 21.1% |
| Immigrants | Australia | 100.0 /100 | #13 | Exceptional 20.9% |
| Immigrants | Switzerland | 100.0 /100 | #14 | Exceptional 20.9% |
| Immigrants | Eastern Asia | 100.0 /100 | #15 | Exceptional 20.8% |
Demographics Similar to Yaqui by Master's Degree
In terms of master's degree, the demographic groups most similar to Yaqui are Choctaw (11.0%, a difference of 0.18%), Seminole (11.0%, a difference of 0.27%), Cajun (11.0%, a difference of 0.40%), Apache (11.0%, a difference of 0.40%), and Hispanic or Latino (10.9%, a difference of 0.74%).
| Demographics | Rating | Rank | Master's Degree |
| Mexican American Indians | 0.0 /100 | #306 | Tragic 11.2% |
| Cheyenne | 0.0 /100 | #307 | Tragic 11.2% |
| Puerto Ricans | 0.0 /100 | #308 | Tragic 11.2% |
| Puget Sound Salish | 0.0 /100 | #309 | Tragic 11.1% |
| Shoshone | 0.0 /100 | #310 | Tragic 11.1% |
| Seminole | 0.0 /100 | #311 | Tragic 11.0% |
| Choctaw | 0.0 /100 | #312 | Tragic 11.0% |
| Yaqui | 0.0 /100 | #313 | Tragic 11.0% |
| Cajuns | 0.0 /100 | #314 | Tragic 11.0% |
| Apache | 0.0 /100 | #315 | Tragic 11.0% |
| Hispanics or Latinos | 0.0 /100 | #316 | Tragic 10.9% |
| Hopi | 0.0 /100 | #317 | Tragic 10.9% |
| Immigrants | Cuba | 0.0 /100 | #318 | Tragic 10.9% |
| Kiowa | 0.0 /100 | #319 | Tragic 10.8% |
| Immigrants | Micronesia | 0.0 /100 | #320 | Tragic 10.8% |