Immigrants from Israel vs Laotian Female Poverty Among 25-34 Year Olds
COMPARE
Immigrants from Israel
Laotian
Female Poverty Among 25-34 Year Olds
Female Poverty Among 25-34 Year Olds Comparison
Immigrants from Israel
Laotians
12.0%
FEMALE POVERTY AMONG 25-34 YEAR OLDS
99.6/ 100
METRIC RATING
53rd/ 347
METRIC RANK
12.2%
FEMALE POVERTY AMONG 25-34 YEAR OLDS
99.2/ 100
METRIC RATING
67th/ 347
METRIC RANK
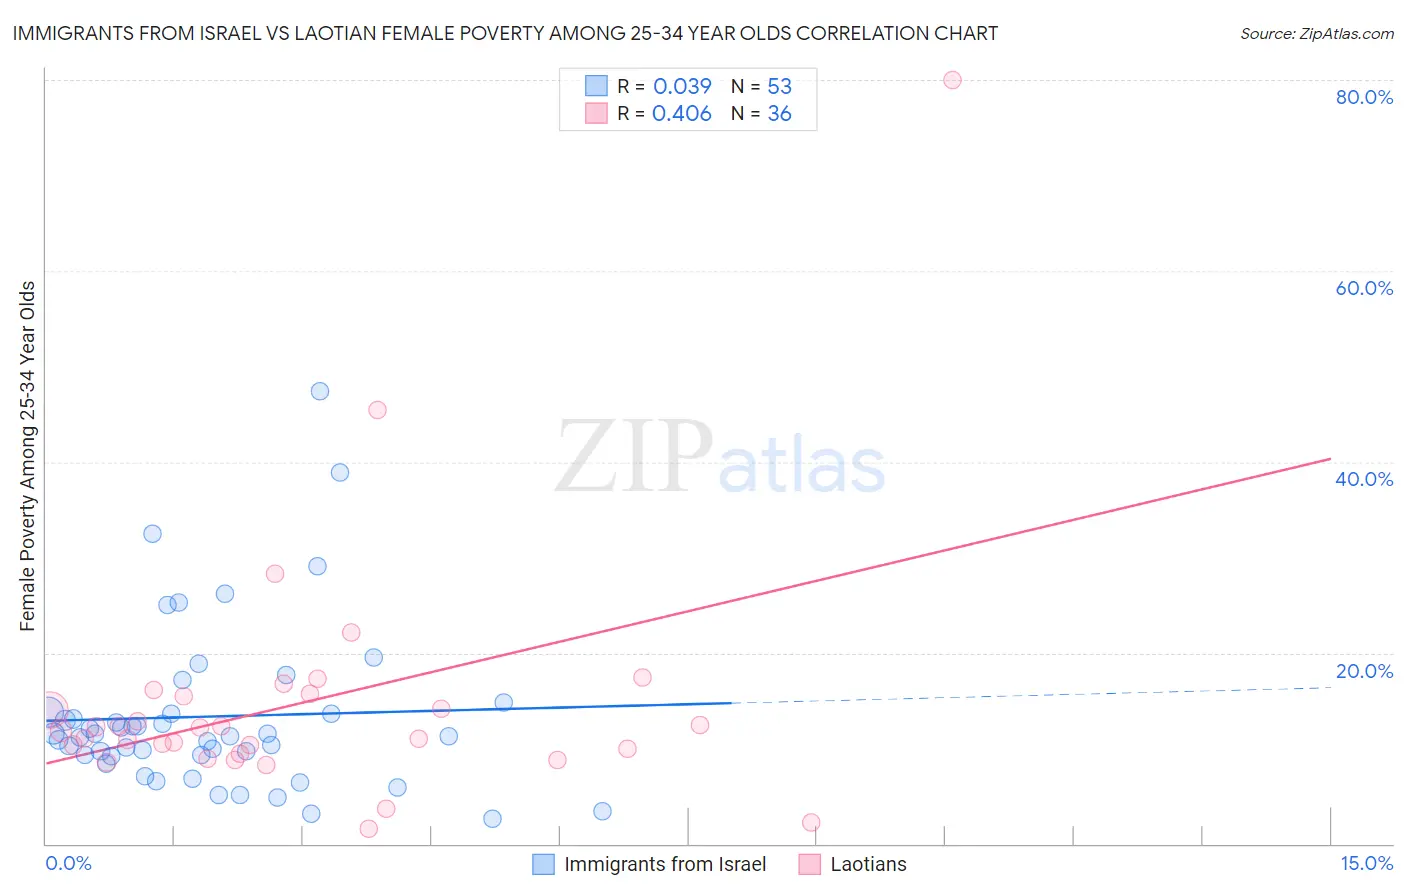
Immigrants from Israel vs Laotian Female Poverty Among 25-34 Year Olds Correlation Chart
The statistical analysis conducted on geographies consisting of 207,529,391 people shows no correlation between the proportion of Immigrants from Israel and poverty level among females between the ages 25 and 34 in the United States with a correlation coefficient (R) of 0.039 and weighted average of 12.0%. Similarly, the statistical analysis conducted on geographies consisting of 223,063,253 people shows a moderate positive correlation between the proportion of Laotians and poverty level among females between the ages 25 and 34 in the United States with a correlation coefficient (R) of 0.406 and weighted average of 12.2%, a difference of 1.6%.
Female Poverty Among 25-34 Year Olds Correlation Summary
| Measurement | Immigrants from Israel | Laotian |
| Minimum | 2.6% | 1.6% |
| Maximum | 47.5% | 80.0% |
| Range | 44.8% | 78.4% |
| Mean | 13.3% | 14.8% |
| Median | 11.2% | 12.0% |
| Interquartile 25% (IQ1) | 9.2% | 9.7% |
| Interquartile 75% (IQ3) | 13.7% | 15.5% |
| Interquartile Range (IQR) | 4.5% | 5.8% |
| Standard Deviation (Sample) | 8.7% | 13.4% |
| Standard Deviation (Population) | 8.6% | 13.2% |
Demographics Similar to Immigrants from Israel and Laotians by Female Poverty Among 25-34 Year Olds
In terms of female poverty among 25-34 year olds, the demographic groups most similar to Immigrants from Israel are Immigrants from Eastern Europe (12.0%, a difference of 0.12%), Eastern European (12.0%, a difference of 0.12%), Paraguayan (12.0%, a difference of 0.14%), Immigrants from Croatia (12.0%, a difference of 0.15%), and Immigrants from Philippines (12.0%, a difference of 0.29%). Similarly, the demographic groups most similar to Laotians are Immigrants from Europe (12.2%, a difference of 0.12%), Armenian (12.2%, a difference of 0.17%), Immigrants from Russia (12.2%, a difference of 0.19%), Sri Lankan (12.2%, a difference of 0.21%), and Immigrants from Lebanon (12.2%, a difference of 0.23%).
| Demographics | Rating | Rank | Female Poverty Among 25-34 Year Olds |
| Immigrants | Croatia | 99.6 /100 | #50 | Exceptional 12.0% |
| Paraguayans | 99.6 /100 | #51 | Exceptional 12.0% |
| Immigrants | Eastern Europe | 99.6 /100 | #52 | Exceptional 12.0% |
| Immigrants | Israel | 99.6 /100 | #53 | Exceptional 12.0% |
| Eastern Europeans | 99.6 /100 | #54 | Exceptional 12.0% |
| Immigrants | Philippines | 99.5 /100 | #55 | Exceptional 12.0% |
| Luxembourgers | 99.5 /100 | #56 | Exceptional 12.1% |
| Jordanians | 99.4 /100 | #57 | Exceptional 12.1% |
| Immigrants | Romania | 99.4 /100 | #58 | Exceptional 12.1% |
| Russians | 99.4 /100 | #59 | Exceptional 12.1% |
| Immigrants | Northern Europe | 99.4 /100 | #60 | Exceptional 12.1% |
| Immigrants | Czechoslovakia | 99.4 /100 | #61 | Exceptional 12.1% |
| Immigrants | Moldova | 99.3 /100 | #62 | Exceptional 12.1% |
| Soviet Union | 99.3 /100 | #63 | Exceptional 12.1% |
| Immigrants | Russia | 99.2 /100 | #64 | Exceptional 12.2% |
| Armenians | 99.2 /100 | #65 | Exceptional 12.2% |
| Immigrants | Europe | 99.2 /100 | #66 | Exceptional 12.2% |
| Laotians | 99.2 /100 | #67 | Exceptional 12.2% |
| Sri Lankans | 99.1 /100 | #68 | Exceptional 12.2% |
| Immigrants | Lebanon | 99.1 /100 | #69 | Exceptional 12.2% |
| Immigrants | Belgium | 99.1 /100 | #70 | Exceptional 12.2% |