Immigrants from Israel vs Immigrants from Europe 6th Grade
COMPARE
Immigrants from Israel
Immigrants from Europe
6th Grade
6th Grade Comparison
Immigrants from Israel
Immigrants from Europe
97.2%
6TH GRADE
76.0/ 100
METRIC RATING
149th/ 347
METRIC RANK
97.3%
6TH GRADE
91.1/ 100
METRIC RATING
131st/ 347
METRIC RANK
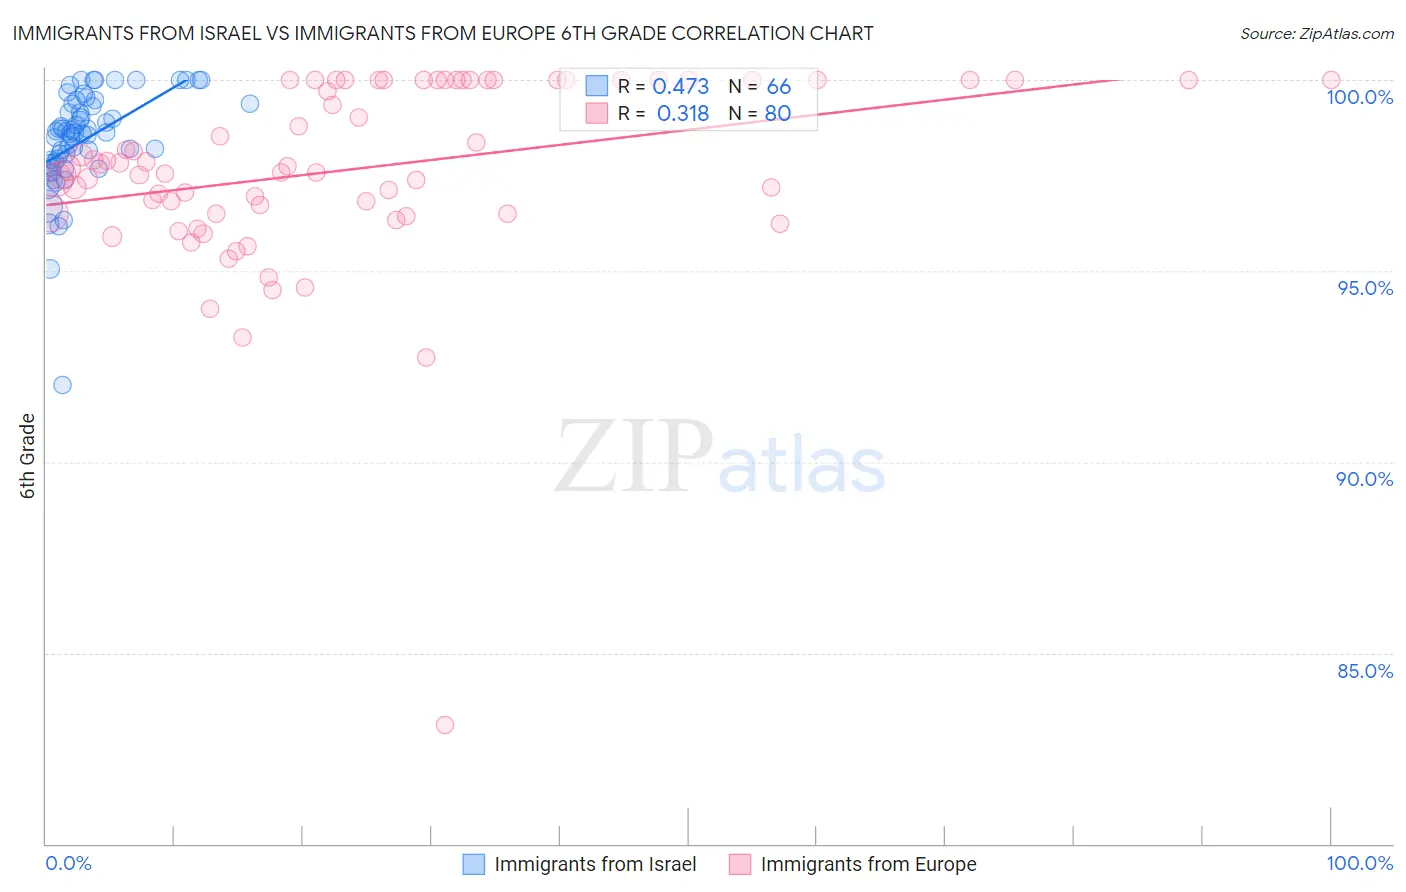
Immigrants from Israel vs Immigrants from Europe 6th Grade Correlation Chart
The statistical analysis conducted on geographies consisting of 210,029,773 people shows a moderate positive correlation between the proportion of Immigrants from Israel and percentage of population with at least 6th grade education in the United States with a correlation coefficient (R) of 0.473 and weighted average of 97.2%. Similarly, the statistical analysis conducted on geographies consisting of 547,425,973 people shows a mild positive correlation between the proportion of Immigrants from Europe and percentage of population with at least 6th grade education in the United States with a correlation coefficient (R) of 0.318 and weighted average of 97.3%, a difference of 0.13%.
6th Grade Correlation Summary
| Measurement | Immigrants from Israel | Immigrants from Europe |
| Minimum | 92.0% | 83.1% |
| Maximum | 100.0% | 100.0% |
| Range | 8.0% | 16.9% |
| Mean | 98.4% | 97.7% |
| Median | 98.6% | 97.7% |
| Interquartile 25% (IQ1) | 97.8% | 96.5% |
| Interquartile 75% (IQ3) | 99.4% | 100.0% |
| Interquartile Range (IQR) | 1.6% | 3.5% |
| Standard Deviation (Sample) | 1.3% | 2.5% |
| Standard Deviation (Population) | 1.3% | 2.5% |
Demographics Similar to Immigrants from Israel and Immigrants from Europe by 6th Grade
In terms of 6th grade, the demographic groups most similar to Immigrants from Israel are Immigrants from South Central Asia (97.2%, a difference of 0.010%), Immigrants from Greece (97.2%, a difference of 0.010%), Immigrants from Bosnia and Herzegovina (97.2%, a difference of 0.010%), Hopi (97.2%, a difference of 0.020%), and Spaniard (97.2%, a difference of 0.030%). Similarly, the demographic groups most similar to Immigrants from Europe are Palestinian (97.3%, a difference of 0.0%), Cambodian (97.3%, a difference of 0.010%), Immigrants from Moldova (97.3%, a difference of 0.010%), Immigrants from Kuwait (97.3%, a difference of 0.020%), and Immigrants from Hungary (97.3%, a difference of 0.020%).
| Demographics | Rating | Rank | 6th Grade |
| Cambodians | 91.8 /100 | #130 | Exceptional 97.3% |
| Immigrants | Europe | 91.1 /100 | #131 | Exceptional 97.3% |
| Palestinians | 90.9 /100 | #132 | Exceptional 97.3% |
| Immigrants | Moldova | 90.0 /100 | #133 | Excellent 97.3% |
| Immigrants | Kuwait | 89.5 /100 | #134 | Excellent 97.3% |
| Immigrants | Hungary | 89.5 /100 | #135 | Excellent 97.3% |
| Filipinos | 88.9 /100 | #136 | Excellent 97.3% |
| Burmese | 87.8 /100 | #137 | Excellent 97.3% |
| Blackfeet | 87.7 /100 | #138 | Excellent 97.3% |
| Immigrants | Turkey | 86.1 /100 | #139 | Excellent 97.3% |
| Immigrants | North Macedonia | 85.5 /100 | #140 | Excellent 97.2% |
| Seminole | 84.8 /100 | #141 | Excellent 97.2% |
| Jordanians | 84.6 /100 | #142 | Excellent 97.2% |
| Pima | 82.9 /100 | #143 | Excellent 97.2% |
| Israelis | 82.9 /100 | #144 | Excellent 97.2% |
| Spaniards | 80.1 /100 | #145 | Excellent 97.2% |
| Hopi | 78.8 /100 | #146 | Good 97.2% |
| Immigrants | South Central Asia | 78.1 /100 | #147 | Good 97.2% |
| Immigrants | Greece | 77.8 /100 | #148 | Good 97.2% |
| Immigrants | Israel | 76.0 /100 | #149 | Good 97.2% |
| Immigrants | Bosnia and Herzegovina | 74.8 /100 | #150 | Good 97.2% |