Immigrants from Iraq vs Danish Male Unemployment
COMPARE
Immigrants from Iraq
Danish
Male Unemployment
Male Unemployment Comparison
Immigrants from Iraq
Danes
5.3%
MALE UNEMPLOYMENT
48.1/ 100
METRIC RATING
175th/ 347
METRIC RANK
4.5%
MALE UNEMPLOYMENT
100.0/ 100
METRIC RATING
5th/ 347
METRIC RANK
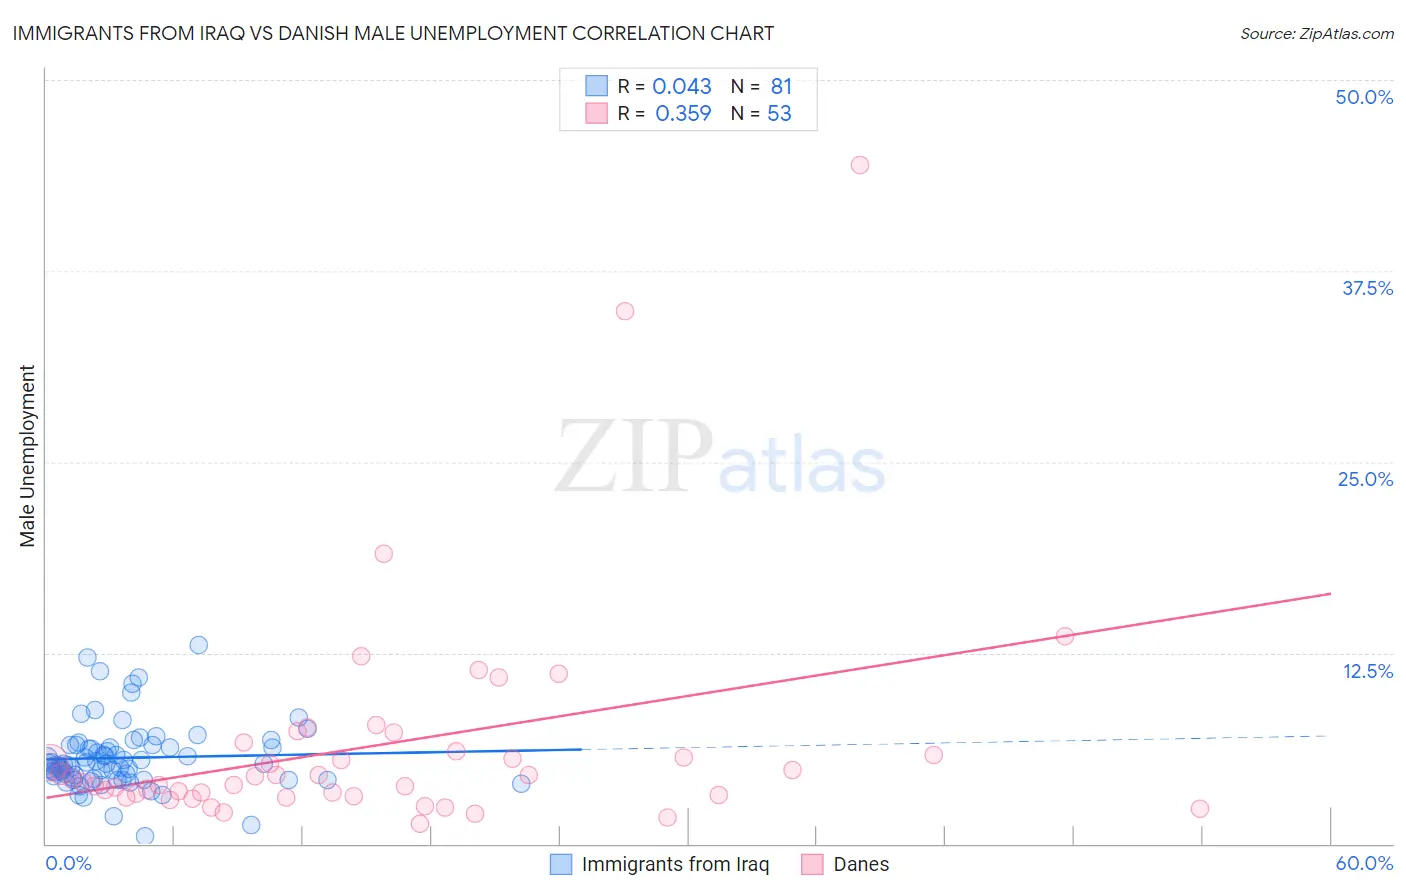
Immigrants from Iraq vs Danish Male Unemployment Correlation Chart
The statistical analysis conducted on geographies consisting of 194,621,150 people shows no correlation between the proportion of Immigrants from Iraq and unemployment rate among males in the United States with a correlation coefficient (R) of 0.043 and weighted average of 5.3%. Similarly, the statistical analysis conducted on geographies consisting of 469,242,434 people shows a mild positive correlation between the proportion of Danes and unemployment rate among males in the United States with a correlation coefficient (R) of 0.359 and weighted average of 4.5%, a difference of 17.9%.
Male Unemployment Correlation Summary
| Measurement | Immigrants from Iraq | Danish |
| Minimum | 0.50% | 1.3% |
| Maximum | 13.0% | 44.4% |
| Range | 12.5% | 43.1% |
| Mean | 5.6% | 6.5% |
| Median | 5.2% | 4.3% |
| Interquartile 25% (IQ1) | 4.3% | 3.1% |
| Interquartile 75% (IQ3) | 6.4% | 6.3% |
| Interquartile Range (IQR) | 2.1% | 3.2% |
| Standard Deviation (Sample) | 2.2% | 7.5% |
| Standard Deviation (Population) | 2.2% | 7.4% |
Similar Demographics by Male Unemployment
Demographics Similar to Immigrants from Iraq by Male Unemployment
In terms of male unemployment, the demographic groups most similar to Immigrants from Iraq are Immigrants from Iran (5.3%, a difference of 0.11%), Immigrants from Poland (5.3%, a difference of 0.12%), Immigrants from Russia (5.3%, a difference of 0.15%), Immigrants from Kazakhstan (5.3%, a difference of 0.16%), and Immigrants from Peru (5.3%, a difference of 0.20%).
| Demographics | Rating | Rank | Male Unemployment |
| Immigrants | Ireland | 57.7 /100 | #168 | Average 5.3% |
| Immigrants | Congo | 57.4 /100 | #169 | Average 5.3% |
| Immigrants | Eastern Europe | 54.1 /100 | #170 | Average 5.3% |
| Peruvians | 51.9 /100 | #171 | Average 5.3% |
| Immigrants | Kazakhstan | 50.8 /100 | #172 | Average 5.3% |
| Immigrants | Russia | 50.7 /100 | #173 | Average 5.3% |
| Immigrants | Iran | 50.0 /100 | #174 | Average 5.3% |
| Immigrants | Iraq | 48.1 /100 | #175 | Average 5.3% |
| Immigrants | Poland | 46.0 /100 | #176 | Average 5.3% |
| Immigrants | Peru | 44.6 /100 | #177 | Average 5.3% |
| Osage | 42.5 /100 | #178 | Average 5.3% |
| Immigrants | Oceania | 40.8 /100 | #179 | Average 5.3% |
| Malaysians | 39.6 /100 | #180 | Fair 5.3% |
| Immigrants | Afghanistan | 37.9 /100 | #181 | Fair 5.3% |
| Potawatomi | 37.8 /100 | #182 | Fair 5.3% |
Demographics Similar to Danes by Male Unemployment
In terms of male unemployment, the demographic groups most similar to Danes are Venezuelan (4.5%, a difference of 0.45%), Czech (4.5%, a difference of 0.65%), Luxembourger (4.5%, a difference of 0.91%), Immigrants from Venezuela (4.4%, a difference of 1.0%), and Norwegian (4.4%, a difference of 1.4%).
| Demographics | Rating | Rank | Male Unemployment |
| Immigrants | India | 100.0 /100 | #1 | Exceptional 4.4% |
| Immigrants | Cuba | 100.0 /100 | #2 | Exceptional 4.4% |
| Norwegians | 100.0 /100 | #3 | Exceptional 4.4% |
| Immigrants | Venezuela | 100.0 /100 | #4 | Exceptional 4.4% |
| Danes | 100.0 /100 | #5 | Exceptional 4.5% |
| Venezuelans | 100.0 /100 | #6 | Exceptional 4.5% |
| Czechs | 100.0 /100 | #7 | Exceptional 4.5% |
| Luxembourgers | 100.0 /100 | #8 | Exceptional 4.5% |
| Thais | 100.0 /100 | #9 | Exceptional 4.6% |
| Cubans | 100.0 /100 | #10 | Exceptional 4.6% |
| Swedes | 100.0 /100 | #11 | Exceptional 4.6% |
| Immigrants | Bolivia | 100.0 /100 | #12 | Exceptional 4.7% |
| Bolivians | 100.0 /100 | #13 | Exceptional 4.7% |
| Germans | 100.0 /100 | #14 | Exceptional 4.7% |
| Scandinavians | 100.0 /100 | #15 | Exceptional 4.7% |