Immigrants from Iran vs Estonian GED/Equivalency
COMPARE
Immigrants from Iran
Estonian
GED/Equivalency
GED/Equivalency Comparison
Immigrants from Iran
Estonians
88.9%
GED/EQUIVALENCY
99.9/ 100
METRIC RATING
13th/ 347
METRIC RANK
88.6%
GED/EQUIVALENCY
99.8/ 100
METRIC RATING
25th/ 347
METRIC RANK
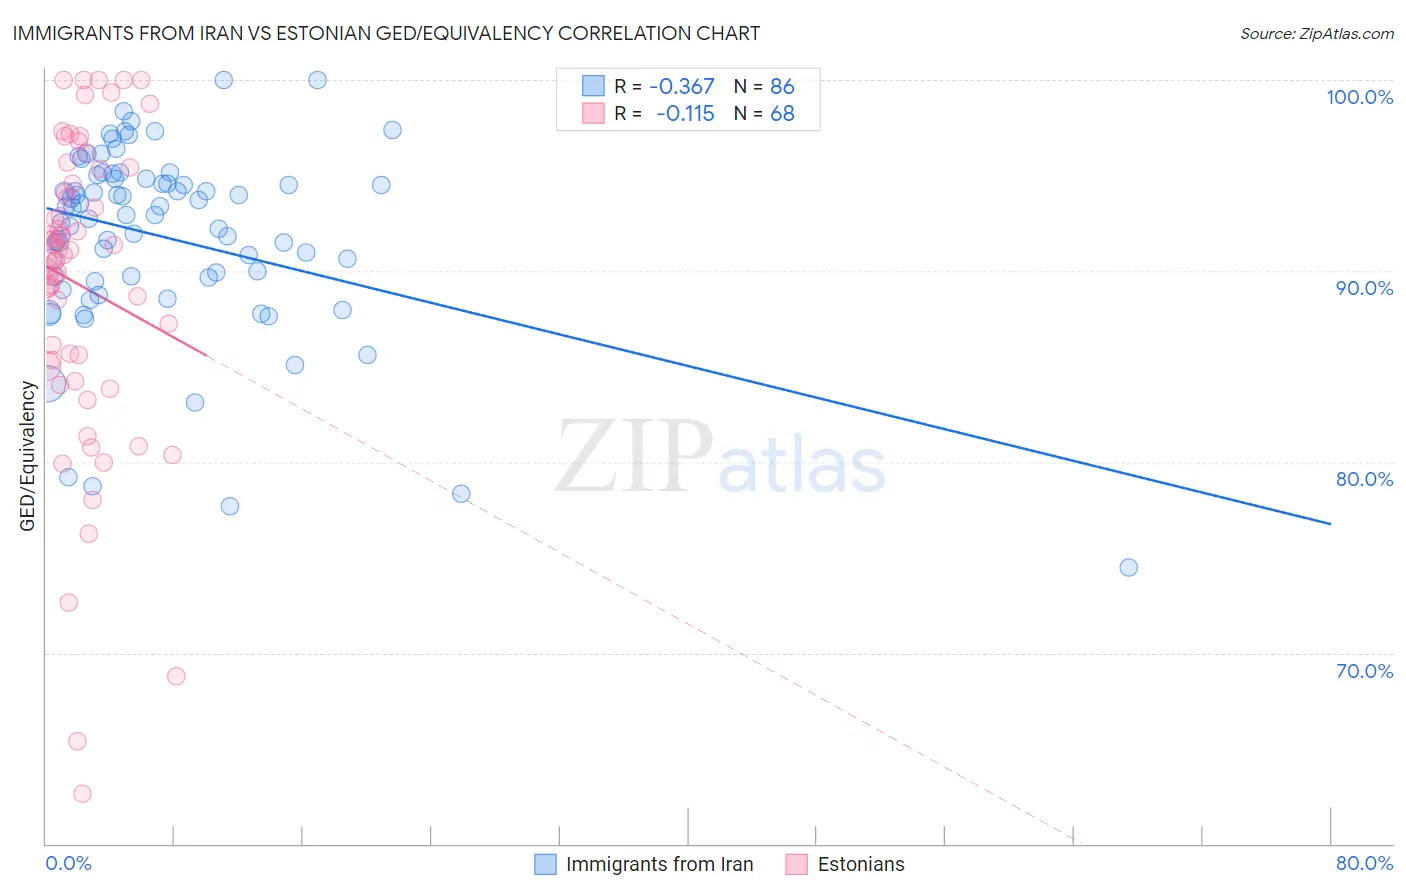
Immigrants from Iran vs Estonian GED/Equivalency Correlation Chart
The statistical analysis conducted on geographies consisting of 279,904,902 people shows a mild negative correlation between the proportion of Immigrants from Iran and percentage of population with at least ged/equivalency education in the United States with a correlation coefficient (R) of -0.367 and weighted average of 88.9%. Similarly, the statistical analysis conducted on geographies consisting of 123,527,724 people shows a poor negative correlation between the proportion of Estonians and percentage of population with at least ged/equivalency education in the United States with a correlation coefficient (R) of -0.115 and weighted average of 88.6%, a difference of 0.38%.
GED/Equivalency Correlation Summary
| Measurement | Immigrants from Iran | Estonian |
| Minimum | 74.5% | 62.6% |
| Maximum | 100.0% | 100.0% |
| Range | 25.5% | 37.4% |
| Mean | 91.8% | 89.2% |
| Median | 92.9% | 91.0% |
| Interquartile 25% (IQ1) | 89.7% | 85.2% |
| Interquartile 75% (IQ3) | 94.8% | 94.9% |
| Interquartile Range (IQR) | 5.1% | 9.8% |
| Standard Deviation (Sample) | 4.9% | 8.1% |
| Standard Deviation (Population) | 4.9% | 8.1% |
Demographics Similar to Immigrants from Iran and Estonians by GED/Equivalency
In terms of ged/equivalency, the demographic groups most similar to Immigrants from Iran are Lithuanian (88.9%, a difference of 0.010%), Cypriot (88.9%, a difference of 0.030%), Bulgarian (89.0%, a difference of 0.050%), Okinawan (88.9%, a difference of 0.050%), and Norwegian (89.0%, a difference of 0.080%). Similarly, the demographic groups most similar to Estonians are Russian (88.6%, a difference of 0.0%), Slovak (88.6%, a difference of 0.0%), Immigrants from Australia (88.6%, a difference of 0.0%), Immigrants from Ireland (88.6%, a difference of 0.020%), and Luxembourger (88.6%, a difference of 0.030%).
| Demographics | Rating | Rank | GED/Equivalency |
| Chinese | 99.9 /100 | #9 | Exceptional 89.0% |
| Norwegians | 99.9 /100 | #10 | Exceptional 89.0% |
| Bulgarians | 99.9 /100 | #11 | Exceptional 89.0% |
| Lithuanians | 99.9 /100 | #12 | Exceptional 88.9% |
| Immigrants | Iran | 99.9 /100 | #13 | Exceptional 88.9% |
| Cypriots | 99.9 /100 | #14 | Exceptional 88.9% |
| Okinawans | 99.9 /100 | #15 | Exceptional 88.9% |
| Immigrants | Taiwan | 99.9 /100 | #16 | Exceptional 88.8% |
| Croatians | 99.9 /100 | #17 | Exceptional 88.8% |
| Slovenes | 99.9 /100 | #18 | Exceptional 88.8% |
| Swedes | 99.9 /100 | #19 | Exceptional 88.8% |
| Maltese | 99.9 /100 | #20 | Exceptional 88.6% |
| Luxembourgers | 99.8 /100 | #21 | Exceptional 88.6% |
| Immigrants | Ireland | 99.8 /100 | #22 | Exceptional 88.6% |
| Russians | 99.8 /100 | #23 | Exceptional 88.6% |
| Slovaks | 99.8 /100 | #24 | Exceptional 88.6% |
| Estonians | 99.8 /100 | #25 | Exceptional 88.6% |
| Immigrants | Australia | 99.8 /100 | #26 | Exceptional 88.6% |
| Immigrants | Lithuania | 99.8 /100 | #27 | Exceptional 88.6% |
| Immigrants | Northern Europe | 99.8 /100 | #28 | Exceptional 88.5% |
| Poles | 99.8 /100 | #29 | Exceptional 88.5% |