Immigrants from India vs Immigrants from West Indies No Schooling Completed
COMPARE
Immigrants from India
Immigrants from West Indies
No Schooling Completed
No Schooling Completed Comparison
Immigrants from India
Immigrants from West Indies
1.7%
NO SCHOOLING COMPLETED
99.4/ 100
METRIC RATING
73rd/ 347
METRIC RANK
2.7%
NO SCHOOLING COMPLETED
0.0/ 100
METRIC RATING
284th/ 347
METRIC RANK
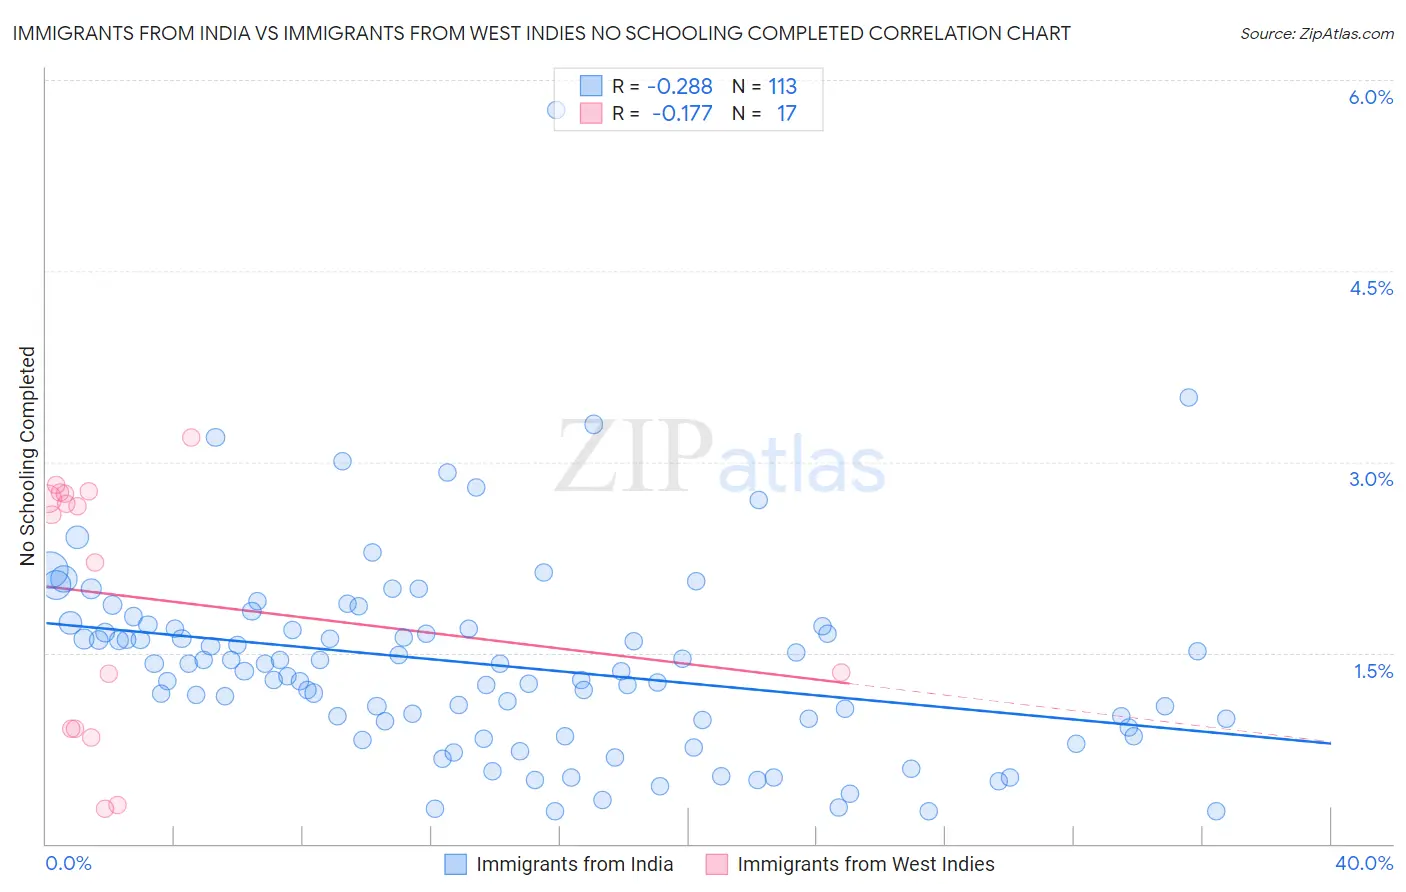
Immigrants from India vs Immigrants from West Indies No Schooling Completed Correlation Chart
The statistical analysis conducted on geographies consisting of 429,114,118 people shows a weak negative correlation between the proportion of Immigrants from India and percentage of population with no schooling in the United States with a correlation coefficient (R) of -0.288 and weighted average of 1.7%. Similarly, the statistical analysis conducted on geographies consisting of 72,438,178 people shows a poor negative correlation between the proportion of Immigrants from West Indies and percentage of population with no schooling in the United States with a correlation coefficient (R) of -0.177 and weighted average of 2.7%, a difference of 53.7%.
No Schooling Completed Correlation Summary
| Measurement | Immigrants from India | Immigrants from West Indies |
| Minimum | 0.25% | 0.28% |
| Maximum | 5.8% | 3.2% |
| Range | 5.5% | 2.9% |
| Mean | 1.4% | 1.9% |
| Median | 1.4% | 2.6% |
| Interquartile 25% (IQ1) | 0.94% | 0.90% |
| Interquartile 75% (IQ3) | 1.7% | 2.8% |
| Interquartile Range (IQR) | 0.75% | 1.9% |
| Standard Deviation (Sample) | 0.79% | 1.0% |
| Standard Deviation (Population) | 0.78% | 0.97% |
Similar Demographics by No Schooling Completed
Demographics Similar to Immigrants from India by No Schooling Completed
In terms of no schooling completed, the demographic groups most similar to Immigrants from India are Zimbabwean (1.7%, a difference of 0.020%), Cajun (1.7%, a difference of 0.48%), Immigrants from Belgium (1.7%, a difference of 0.60%), Immigrants from England (1.7%, a difference of 0.65%), and Cherokee (1.7%, a difference of 0.65%).
| Demographics | Rating | Rank | No Schooling Completed |
| Canadians | 99.7 /100 | #66 | Exceptional 1.7% |
| Immigrants | Austria | 99.7 /100 | #67 | Exceptional 1.7% |
| Immigrants | Lithuania | 99.7 /100 | #68 | Exceptional 1.7% |
| Chickasaw | 99.6 /100 | #69 | Exceptional 1.7% |
| Immigrants | Netherlands | 99.6 /100 | #70 | Exceptional 1.7% |
| Immigrants | England | 99.5 /100 | #71 | Exceptional 1.7% |
| Cajuns | 99.5 /100 | #72 | Exceptional 1.7% |
| Immigrants | India | 99.4 /100 | #73 | Exceptional 1.7% |
| Zimbabweans | 99.4 /100 | #74 | Exceptional 1.7% |
| Immigrants | Belgium | 99.3 /100 | #75 | Exceptional 1.7% |
| Cherokee | 99.3 /100 | #76 | Exceptional 1.7% |
| Immigrants | Sweden | 99.3 /100 | #77 | Exceptional 1.7% |
| Delaware | 99.3 /100 | #78 | Exceptional 1.7% |
| Macedonians | 99.3 /100 | #79 | Exceptional 1.7% |
| Cypriots | 99.3 /100 | #80 | Exceptional 1.7% |
Demographics Similar to Immigrants from West Indies by No Schooling Completed
In terms of no schooling completed, the demographic groups most similar to Immigrants from West Indies are Immigrants from Barbados (2.7%, a difference of 0.070%), Immigrants from Portugal (2.7%, a difference of 0.49%), Immigrants from Trinidad and Tobago (2.6%, a difference of 0.72%), Immigrants from Afghanistan (2.7%, a difference of 1.3%), and Immigrants from St. Vincent and the Grenadines (2.7%, a difference of 1.4%).
| Demographics | Rating | Rank | No Schooling Completed |
| Immigrants | Philippines | 0.1 /100 | #277 | Tragic 2.6% |
| Immigrants | Uzbekistan | 0.1 /100 | #278 | Tragic 2.6% |
| Barbadians | 0.1 /100 | #279 | Tragic 2.6% |
| Trinidadians and Tobagonians | 0.1 /100 | #280 | Tragic 2.6% |
| Afghans | 0.1 /100 | #281 | Tragic 2.6% |
| Immigrants | Ghana | 0.1 /100 | #282 | Tragic 2.6% |
| Immigrants | Trinidad and Tobago | 0.0 /100 | #283 | Tragic 2.6% |
| Immigrants | West Indies | 0.0 /100 | #284 | Tragic 2.7% |
| Immigrants | Barbados | 0.0 /100 | #285 | Tragic 2.7% |
| Immigrants | Portugal | 0.0 /100 | #286 | Tragic 2.7% |
| Immigrants | Afghanistan | 0.0 /100 | #287 | Tragic 2.7% |
| Immigrants | St. Vincent and the Grenadines | 0.0 /100 | #288 | Tragic 2.7% |
| Immigrants | Thailand | 0.0 /100 | #289 | Tragic 2.7% |
| Immigrants | Hong Kong | 0.0 /100 | #290 | Tragic 2.7% |
| British West Indians | 0.0 /100 | #291 | Tragic 2.7% |