Immigrants from India vs Macedonian Doctorate Degree
COMPARE
Immigrants from India
Macedonian
Doctorate Degree
Doctorate Degree Comparison
Immigrants from India
Macedonians
2.8%
DOCTORATE DEGREE
100.0/ 100
METRIC RATING
15th/ 347
METRIC RANK
1.9%
DOCTORATE DEGREE
60.9/ 100
METRIC RATING
167th/ 347
METRIC RANK
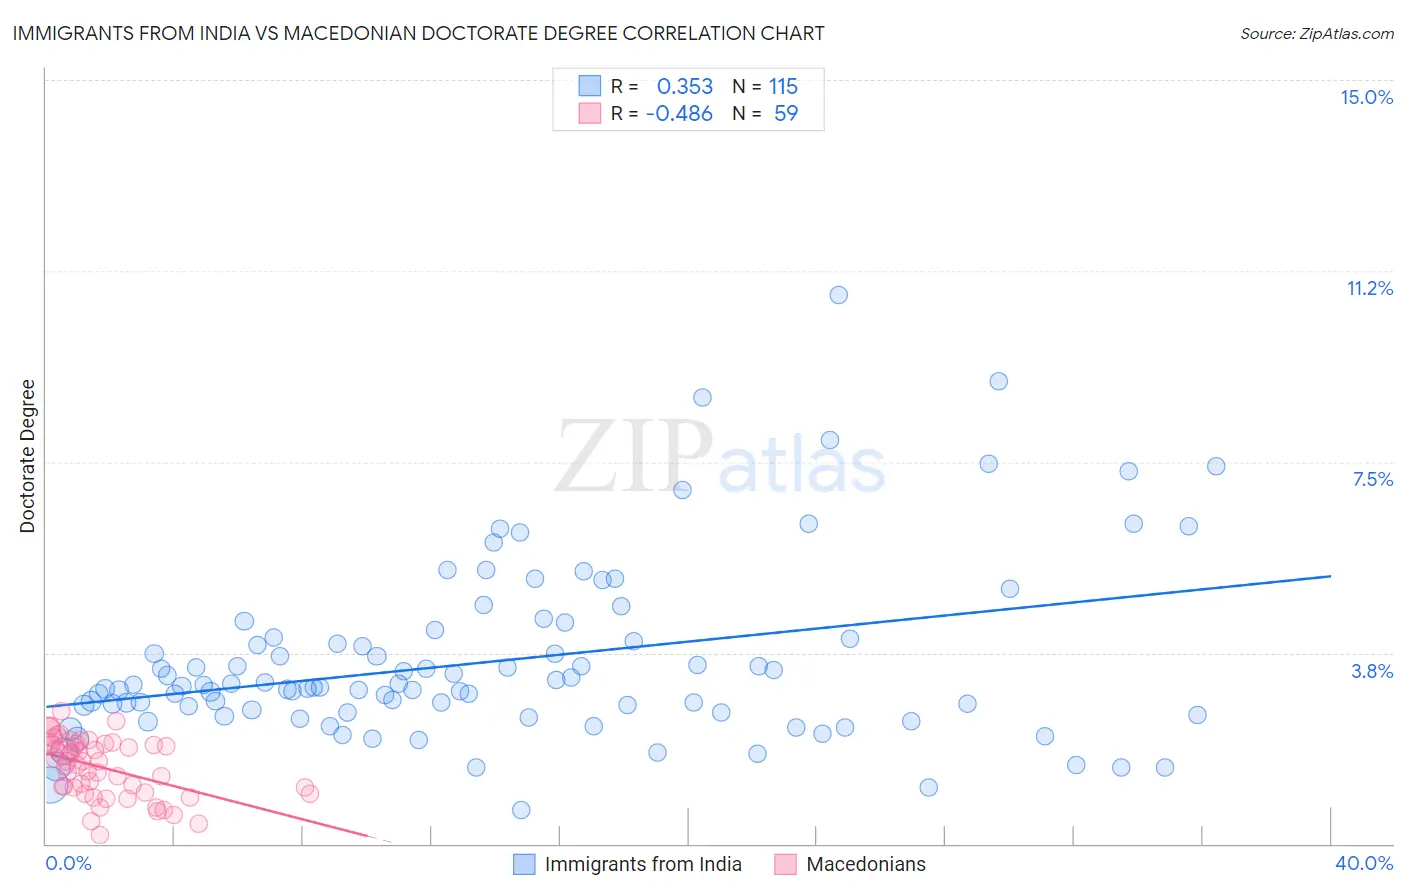
Immigrants from India vs Macedonian Doctorate Degree Correlation Chart
The statistical analysis conducted on geographies consisting of 430,386,279 people shows a mild positive correlation between the proportion of Immigrants from India and percentage of population with at least doctorate degree education in the United States with a correlation coefficient (R) of 0.353 and weighted average of 2.8%. Similarly, the statistical analysis conducted on geographies consisting of 132,009,126 people shows a moderate negative correlation between the proportion of Macedonians and percentage of population with at least doctorate degree education in the United States with a correlation coefficient (R) of -0.486 and weighted average of 1.9%, a difference of 51.4%.
Doctorate Degree Correlation Summary
| Measurement | Immigrants from India | Macedonian |
| Minimum | 0.66% | 0.17% |
| Maximum | 10.8% | 2.6% |
| Range | 10.1% | 2.4% |
| Mean | 3.6% | 1.5% |
| Median | 3.1% | 1.6% |
| Interquartile 25% (IQ1) | 2.6% | 1.0% |
| Interquartile 75% (IQ3) | 4.0% | 2.0% |
| Interquartile Range (IQR) | 1.4% | 0.95% |
| Standard Deviation (Sample) | 1.7% | 0.57% |
| Standard Deviation (Population) | 1.7% | 0.57% |
Similar Demographics by Doctorate Degree
Demographics Similar to Immigrants from India by Doctorate Degree
In terms of doctorate degree, the demographic groups most similar to Immigrants from India are Eastern European (2.8%, a difference of 0.32%), Immigrants from Australia (2.8%, a difference of 1.0%), Immigrants from France (2.9%, a difference of 1.1%), Immigrants from Sweden (2.9%, a difference of 1.2%), and Immigrants from Sri Lanka (2.8%, a difference of 1.3%).
| Demographics | Rating | Rank | Doctorate Degree |
| Immigrants | Israel | 100.0 /100 | #8 | Exceptional 3.0% |
| Immigrants | Iran | 100.0 /100 | #9 | Exceptional 3.0% |
| Immigrants | Eastern Asia | 100.0 /100 | #10 | Exceptional 3.0% |
| Indians (Asian) | 100.0 /100 | #11 | Exceptional 2.9% |
| Immigrants | Belgium | 100.0 /100 | #12 | Exceptional 2.9% |
| Immigrants | Sweden | 100.0 /100 | #13 | Exceptional 2.9% |
| Immigrants | France | 100.0 /100 | #14 | Exceptional 2.9% |
| Immigrants | India | 100.0 /100 | #15 | Exceptional 2.8% |
| Eastern Europeans | 100.0 /100 | #16 | Exceptional 2.8% |
| Immigrants | Australia | 100.0 /100 | #17 | Exceptional 2.8% |
| Immigrants | Sri Lanka | 100.0 /100 | #18 | Exceptional 2.8% |
| Immigrants | Japan | 100.0 /100 | #19 | Exceptional 2.8% |
| Immigrants | Hong Kong | 100.0 /100 | #20 | Exceptional 2.8% |
| Thais | 100.0 /100 | #21 | Exceptional 2.8% |
| Mongolians | 100.0 /100 | #22 | Exceptional 2.8% |
Demographics Similar to Macedonians by Doctorate Degree
In terms of doctorate degree, the demographic groups most similar to Macedonians are Sri Lankan (1.9%, a difference of 0.10%), Spaniard (1.9%, a difference of 0.39%), Scotch-Irish (1.9%, a difference of 0.41%), Celtic (1.9%, a difference of 0.90%), and Vietnamese (1.9%, a difference of 0.92%).
| Demographics | Rating | Rank | Doctorate Degree |
| Welsh | 69.7 /100 | #160 | Good 1.9% |
| Immigrants | Middle Africa | 68.8 /100 | #161 | Good 1.9% |
| Irish | 67.5 /100 | #162 | Good 1.9% |
| Czechs | 67.3 /100 | #163 | Good 1.9% |
| Celtics | 66.7 /100 | #164 | Good 1.9% |
| Scotch-Irish | 63.6 /100 | #165 | Good 1.9% |
| Spaniards | 63.5 /100 | #166 | Good 1.9% |
| Macedonians | 60.9 /100 | #167 | Good 1.9% |
| Sri Lankans | 60.3 /100 | #168 | Good 1.9% |
| Vietnamese | 54.8 /100 | #169 | Average 1.9% |
| Costa Ricans | 53.3 /100 | #170 | Average 1.8% |
| Bermudans | 52.1 /100 | #171 | Average 1.8% |
| Belgians | 50.3 /100 | #172 | Average 1.8% |
| Norwegians | 50.0 /100 | #173 | Average 1.8% |
| Immigrants | Bangladesh | 50.0 /100 | #174 | Average 1.8% |