Immigrants from India vs Belizean Doctorate Degree
COMPARE
Immigrants from India
Belizean
Doctorate Degree
Doctorate Degree Comparison
Immigrants from India
Belizeans
2.8%
DOCTORATE DEGREE
100.0/ 100
METRIC RATING
15th/ 347
METRIC RANK
1.4%
DOCTORATE DEGREE
0.1/ 100
METRIC RATING
299th/ 347
METRIC RANK
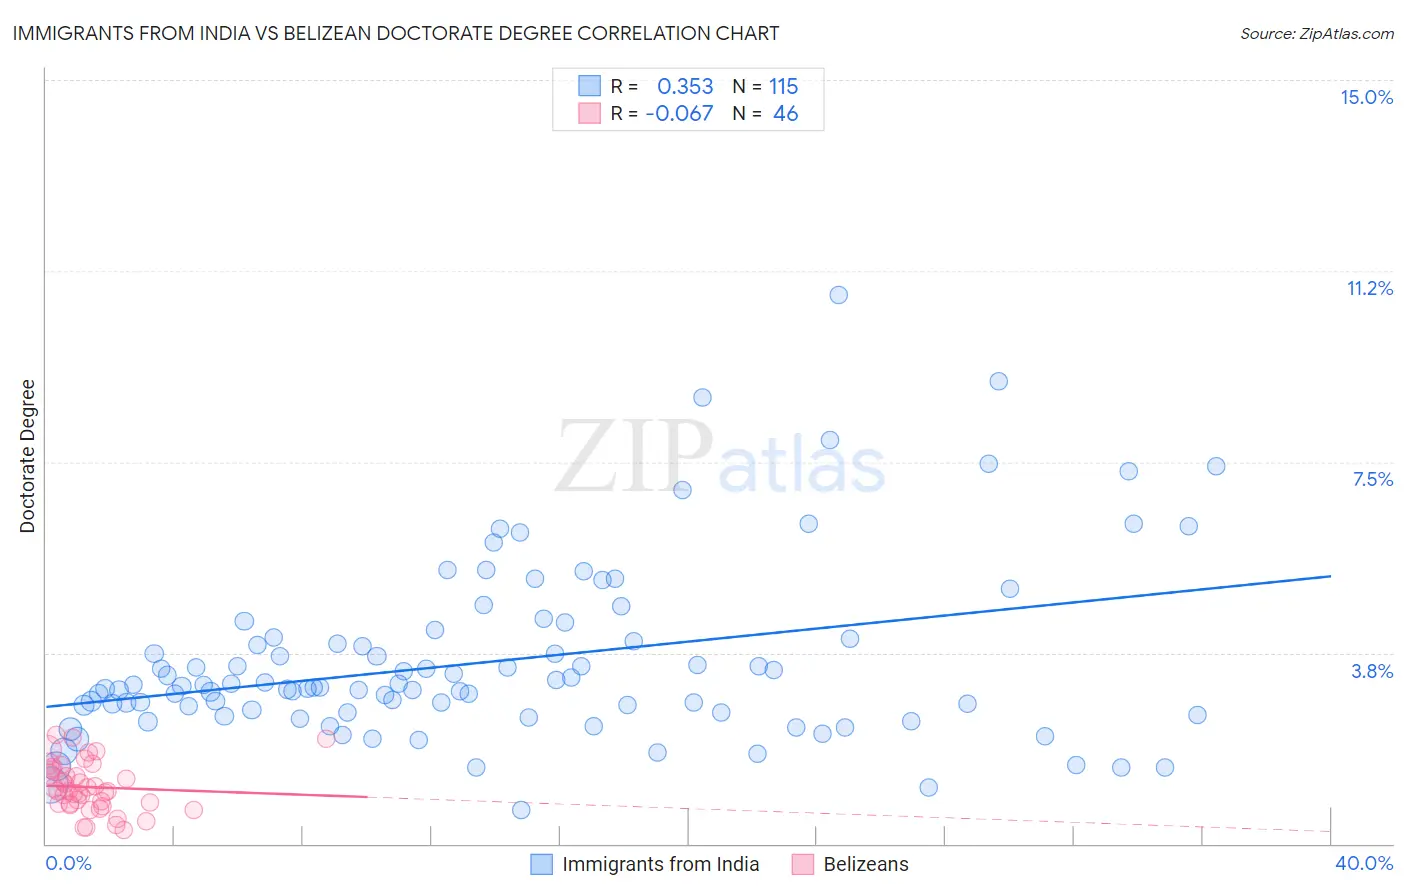
Immigrants from India vs Belizean Doctorate Degree Correlation Chart
The statistical analysis conducted on geographies consisting of 430,386,279 people shows a mild positive correlation between the proportion of Immigrants from India and percentage of population with at least doctorate degree education in the United States with a correlation coefficient (R) of 0.353 and weighted average of 2.8%. Similarly, the statistical analysis conducted on geographies consisting of 143,625,069 people shows a slight negative correlation between the proportion of Belizeans and percentage of population with at least doctorate degree education in the United States with a correlation coefficient (R) of -0.067 and weighted average of 1.4%, a difference of 103.1%.
Doctorate Degree Correlation Summary
| Measurement | Immigrants from India | Belizean |
| Minimum | 0.66% | 0.28% |
| Maximum | 10.8% | 2.1% |
| Range | 10.1% | 1.9% |
| Mean | 3.6% | 1.1% |
| Median | 3.1% | 1.0% |
| Interquartile 25% (IQ1) | 2.6% | 0.78% |
| Interquartile 75% (IQ3) | 4.0% | 1.5% |
| Interquartile Range (IQR) | 1.4% | 0.68% |
| Standard Deviation (Sample) | 1.7% | 0.48% |
| Standard Deviation (Population) | 1.7% | 0.48% |
Similar Demographics by Doctorate Degree
Demographics Similar to Immigrants from India by Doctorate Degree
In terms of doctorate degree, the demographic groups most similar to Immigrants from India are Eastern European (2.8%, a difference of 0.32%), Immigrants from Australia (2.8%, a difference of 1.0%), Immigrants from France (2.9%, a difference of 1.1%), Immigrants from Sweden (2.9%, a difference of 1.2%), and Immigrants from Sri Lanka (2.8%, a difference of 1.3%).
| Demographics | Rating | Rank | Doctorate Degree |
| Immigrants | Israel | 100.0 /100 | #8 | Exceptional 3.0% |
| Immigrants | Iran | 100.0 /100 | #9 | Exceptional 3.0% |
| Immigrants | Eastern Asia | 100.0 /100 | #10 | Exceptional 3.0% |
| Indians (Asian) | 100.0 /100 | #11 | Exceptional 2.9% |
| Immigrants | Belgium | 100.0 /100 | #12 | Exceptional 2.9% |
| Immigrants | Sweden | 100.0 /100 | #13 | Exceptional 2.9% |
| Immigrants | France | 100.0 /100 | #14 | Exceptional 2.9% |
| Immigrants | India | 100.0 /100 | #15 | Exceptional 2.8% |
| Eastern Europeans | 100.0 /100 | #16 | Exceptional 2.8% |
| Immigrants | Australia | 100.0 /100 | #17 | Exceptional 2.8% |
| Immigrants | Sri Lanka | 100.0 /100 | #18 | Exceptional 2.8% |
| Immigrants | Japan | 100.0 /100 | #19 | Exceptional 2.8% |
| Immigrants | Hong Kong | 100.0 /100 | #20 | Exceptional 2.8% |
| Thais | 100.0 /100 | #21 | Exceptional 2.8% |
| Mongolians | 100.0 /100 | #22 | Exceptional 2.8% |
Demographics Similar to Belizeans by Doctorate Degree
In terms of doctorate degree, the demographic groups most similar to Belizeans are Immigrants from Guatemala (1.4%, a difference of 0.33%), Honduran (1.4%, a difference of 0.40%), Puerto Rican (1.4%, a difference of 0.43%), Shoshone (1.4%, a difference of 0.73%), and Immigrants from Dominica (1.4%, a difference of 0.76%).
| Demographics | Rating | Rank | Doctorate Degree |
| Alaska Natives | 0.3 /100 | #292 | Tragic 1.4% |
| Immigrants | Yemen | 0.2 /100 | #293 | Tragic 1.4% |
| Samoans | 0.2 /100 | #294 | Tragic 1.4% |
| Guatemalans | 0.2 /100 | #295 | Tragic 1.4% |
| Immigrants | Ecuador | 0.2 /100 | #296 | Tragic 1.4% |
| Tsimshian | 0.2 /100 | #297 | Tragic 1.4% |
| Puerto Ricans | 0.1 /100 | #298 | Tragic 1.4% |
| Belizeans | 0.1 /100 | #299 | Tragic 1.4% |
| Immigrants | Guatemala | 0.1 /100 | #300 | Tragic 1.4% |
| Hondurans | 0.1 /100 | #301 | Tragic 1.4% |
| Shoshone | 0.1 /100 | #302 | Tragic 1.4% |
| Immigrants | Dominica | 0.1 /100 | #303 | Tragic 1.4% |
| Mexican American Indians | 0.1 /100 | #304 | Tragic 1.4% |
| Pennsylvania Germans | 0.1 /100 | #305 | Tragic 1.4% |
| Guyanese | 0.1 /100 | #306 | Tragic 1.4% |