Immigrants from India vs Immigrants from Philippines Doctorate Degree
COMPARE
Immigrants from India
Immigrants from Philippines
Doctorate Degree
Doctorate Degree Comparison
Immigrants from India
Immigrants from Philippines
2.8%
DOCTORATE DEGREE
100.0/ 100
METRIC RATING
15th/ 347
METRIC RANK
1.6%
DOCTORATE DEGREE
4.3/ 100
METRIC RATING
230th/ 347
METRIC RANK
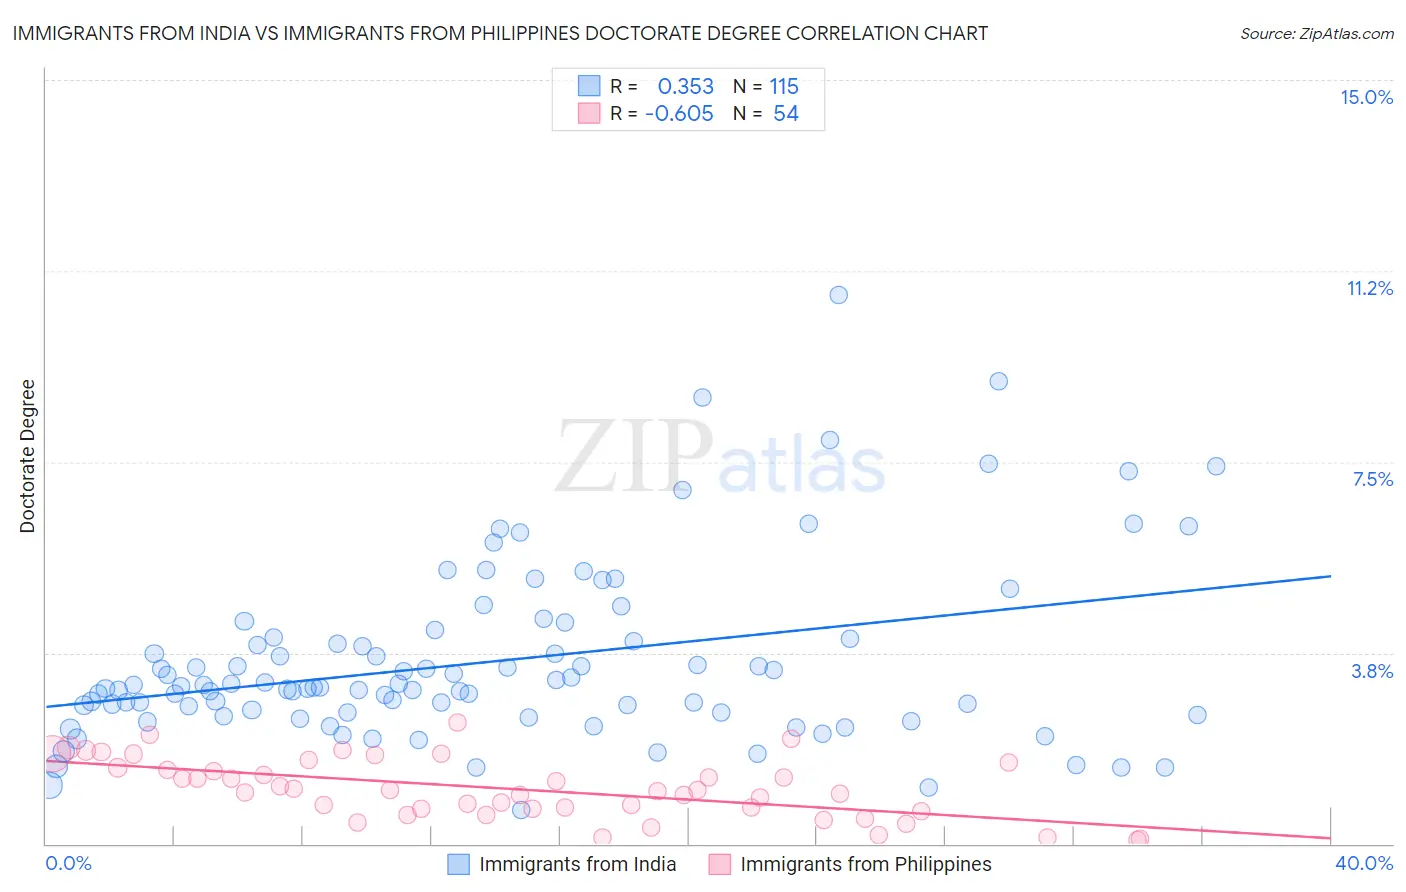
Immigrants from India vs Immigrants from Philippines Doctorate Degree Correlation Chart
The statistical analysis conducted on geographies consisting of 430,386,279 people shows a mild positive correlation between the proportion of Immigrants from India and percentage of population with at least doctorate degree education in the United States with a correlation coefficient (R) of 0.353 and weighted average of 2.8%. Similarly, the statistical analysis conducted on geographies consisting of 464,152,098 people shows a significant negative correlation between the proportion of Immigrants from Philippines and percentage of population with at least doctorate degree education in the United States with a correlation coefficient (R) of -0.605 and weighted average of 1.6%, a difference of 73.6%.
Doctorate Degree Correlation Summary
| Measurement | Immigrants from India | Immigrants from Philippines |
| Minimum | 0.66% | 0.076% |
| Maximum | 10.8% | 2.4% |
| Range | 10.1% | 2.3% |
| Mean | 3.6% | 1.1% |
| Median | 3.1% | 1.0% |
| Interquartile 25% (IQ1) | 2.6% | 0.68% |
| Interquartile 75% (IQ3) | 4.0% | 1.5% |
| Interquartile Range (IQR) | 1.4% | 0.81% |
| Standard Deviation (Sample) | 1.7% | 0.58% |
| Standard Deviation (Population) | 1.7% | 0.57% |
Similar Demographics by Doctorate Degree
Demographics Similar to Immigrants from India by Doctorate Degree
In terms of doctorate degree, the demographic groups most similar to Immigrants from India are Eastern European (2.8%, a difference of 0.32%), Immigrants from Australia (2.8%, a difference of 1.0%), Immigrants from France (2.9%, a difference of 1.1%), Immigrants from Sweden (2.9%, a difference of 1.2%), and Immigrants from Sri Lanka (2.8%, a difference of 1.3%).
| Demographics | Rating | Rank | Doctorate Degree |
| Immigrants | Israel | 100.0 /100 | #8 | Exceptional 3.0% |
| Immigrants | Iran | 100.0 /100 | #9 | Exceptional 3.0% |
| Immigrants | Eastern Asia | 100.0 /100 | #10 | Exceptional 3.0% |
| Indians (Asian) | 100.0 /100 | #11 | Exceptional 2.9% |
| Immigrants | Belgium | 100.0 /100 | #12 | Exceptional 2.9% |
| Immigrants | Sweden | 100.0 /100 | #13 | Exceptional 2.9% |
| Immigrants | France | 100.0 /100 | #14 | Exceptional 2.9% |
| Immigrants | India | 100.0 /100 | #15 | Exceptional 2.8% |
| Eastern Europeans | 100.0 /100 | #16 | Exceptional 2.8% |
| Immigrants | Australia | 100.0 /100 | #17 | Exceptional 2.8% |
| Immigrants | Sri Lanka | 100.0 /100 | #18 | Exceptional 2.8% |
| Immigrants | Japan | 100.0 /100 | #19 | Exceptional 2.8% |
| Immigrants | Hong Kong | 100.0 /100 | #20 | Exceptional 2.8% |
| Thais | 100.0 /100 | #21 | Exceptional 2.8% |
| Mongolians | 100.0 /100 | #22 | Exceptional 2.8% |
Demographics Similar to Immigrants from Philippines by Doctorate Degree
In terms of doctorate degree, the demographic groups most similar to Immigrants from Philippines are Colville (1.6%, a difference of 0.31%), Immigrants from North Macedonia (1.6%, a difference of 0.47%), Guamanian/Chamorro (1.6%, a difference of 1.2%), Barbadian (1.6%, a difference of 1.2%), and Assyrian/Chaldean/Syriac (1.7%, a difference of 1.3%).
| Demographics | Rating | Rank | Doctorate Degree |
| Immigrants | Bosnia and Herzegovina | 7.8 /100 | #223 | Tragic 1.7% |
| Immigrants | Poland | 7.4 /100 | #224 | Tragic 1.7% |
| Immigrants | Colombia | 6.7 /100 | #225 | Tragic 1.7% |
| Osage | 6.5 /100 | #226 | Tragic 1.7% |
| Panamanians | 6.3 /100 | #227 | Tragic 1.7% |
| Assyrians/Chaldeans/Syriacs | 5.9 /100 | #228 | Tragic 1.7% |
| Colville | 4.7 /100 | #229 | Tragic 1.6% |
| Immigrants | Philippines | 4.3 /100 | #230 | Tragic 1.6% |
| Immigrants | North Macedonia | 3.9 /100 | #231 | Tragic 1.6% |
| Guamanians/Chamorros | 3.3 /100 | #232 | Tragic 1.6% |
| Barbadians | 3.3 /100 | #233 | Tragic 1.6% |
| Hopi | 3.2 /100 | #234 | Tragic 1.6% |
| Cree | 3.0 /100 | #235 | Tragic 1.6% |
| Indonesians | 2.8 /100 | #236 | Tragic 1.6% |
| Iroquois | 2.7 /100 | #237 | Tragic 1.6% |