Immigrants from Albania vs Macedonian Doctorate Degree
COMPARE
Immigrants from Albania
Macedonian
Doctorate Degree
Doctorate Degree Comparison
Immigrants from Albania
Macedonians
1.9%
DOCTORATE DEGREE
72.8/ 100
METRIC RATING
154th/ 347
METRIC RANK
1.9%
DOCTORATE DEGREE
60.9/ 100
METRIC RATING
167th/ 347
METRIC RANK
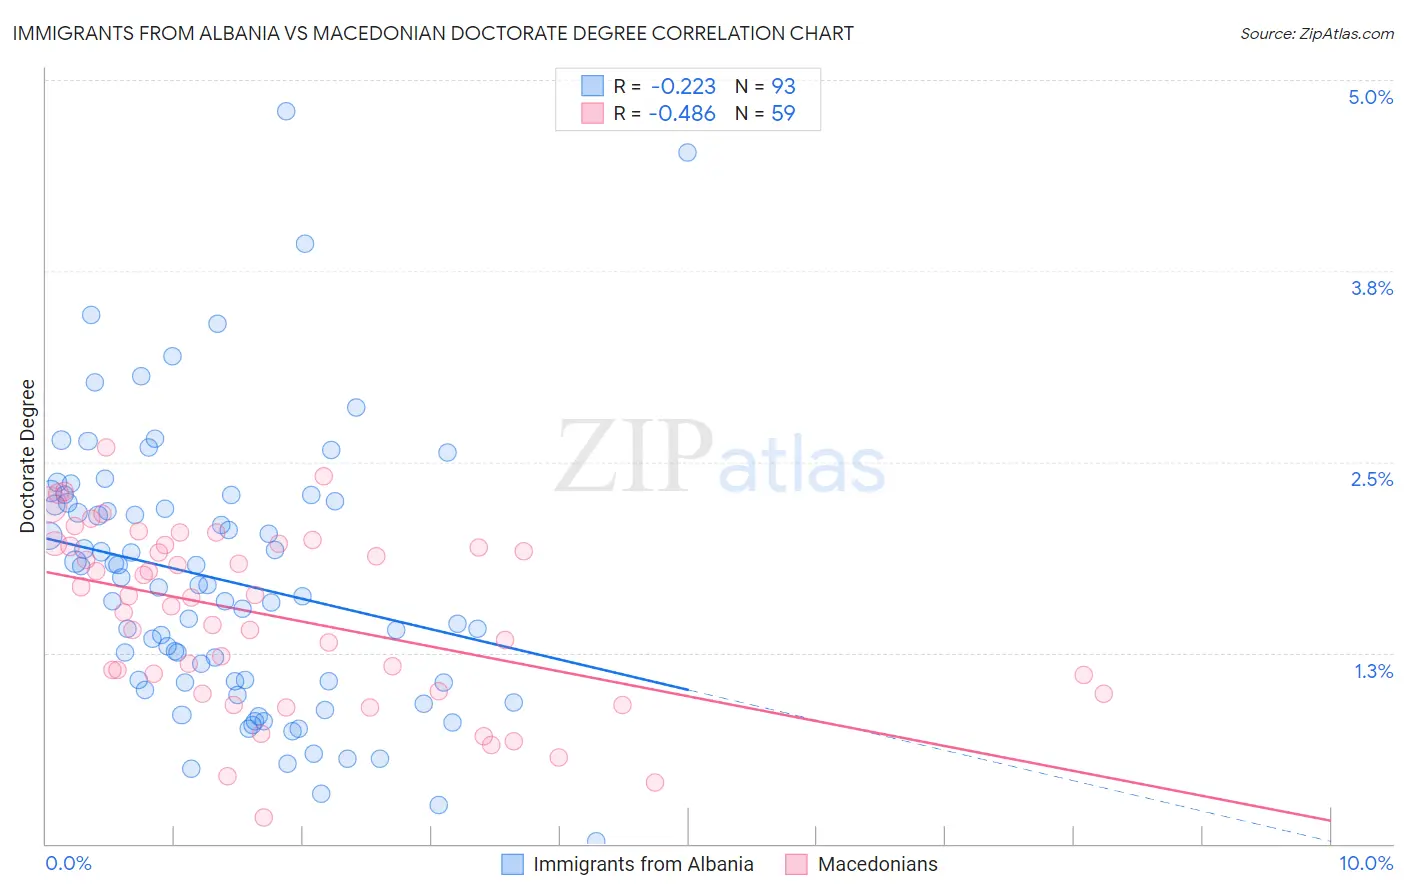
Immigrants from Albania vs Macedonian Doctorate Degree Correlation Chart
The statistical analysis conducted on geographies consisting of 119,213,784 people shows a weak negative correlation between the proportion of Immigrants from Albania and percentage of population with at least doctorate degree education in the United States with a correlation coefficient (R) of -0.223 and weighted average of 1.9%. Similarly, the statistical analysis conducted on geographies consisting of 132,009,126 people shows a moderate negative correlation between the proportion of Macedonians and percentage of population with at least doctorate degree education in the United States with a correlation coefficient (R) of -0.486 and weighted average of 1.9%, a difference of 1.9%.
Doctorate Degree Correlation Summary
| Measurement | Immigrants from Albania | Macedonian |
| Minimum | 0.013% | 0.17% |
| Maximum | 4.8% | 2.6% |
| Range | 4.8% | 2.4% |
| Mean | 1.7% | 1.5% |
| Median | 1.7% | 1.6% |
| Interquartile 25% (IQ1) | 1.1% | 1.0% |
| Interquartile 75% (IQ3) | 2.2% | 2.0% |
| Interquartile Range (IQR) | 1.2% | 0.95% |
| Standard Deviation (Sample) | 0.90% | 0.57% |
| Standard Deviation (Population) | 0.89% | 0.57% |
Demographics Similar to Immigrants from Albania and Macedonians by Doctorate Degree
In terms of doctorate degree, the demographic groups most similar to Immigrants from Albania are Polish (1.9%, a difference of 0.020%), Slavic (1.9%, a difference of 0.080%), Danish (1.9%, a difference of 0.16%), Hungarian (1.9%, a difference of 0.19%), and Immigrants from Oceania (1.9%, a difference of 0.22%). Similarly, the demographic groups most similar to Macedonians are Sri Lankan (1.9%, a difference of 0.10%), Spaniard (1.9%, a difference of 0.39%), Scotch-Irish (1.9%, a difference of 0.41%), Celtic (1.9%, a difference of 0.90%), and Vietnamese (1.9%, a difference of 0.92%).
| Demographics | Rating | Rank | Doctorate Degree |
| English | 75.9 /100 | #150 | Good 1.9% |
| Albanians | 74.8 /100 | #151 | Good 1.9% |
| Immigrants | Kenya | 74.3 /100 | #152 | Good 1.9% |
| Immigrants | Oceania | 74.0 /100 | #153 | Good 1.9% |
| Immigrants | Albania | 72.8 /100 | #154 | Good 1.9% |
| Poles | 72.7 /100 | #155 | Good 1.9% |
| Slavs | 72.4 /100 | #156 | Good 1.9% |
| Danes | 71.9 /100 | #157 | Good 1.9% |
| Hungarians | 71.7 /100 | #158 | Good 1.9% |
| Slovenes | 70.2 /100 | #159 | Good 1.9% |
| Welsh | 69.7 /100 | #160 | Good 1.9% |
| Immigrants | Middle Africa | 68.8 /100 | #161 | Good 1.9% |
| Irish | 67.5 /100 | #162 | Good 1.9% |
| Czechs | 67.3 /100 | #163 | Good 1.9% |
| Celtics | 66.7 /100 | #164 | Good 1.9% |
| Scotch-Irish | 63.6 /100 | #165 | Good 1.9% |
| Spaniards | 63.5 /100 | #166 | Good 1.9% |
| Macedonians | 60.9 /100 | #167 | Good 1.9% |
| Sri Lankans | 60.3 /100 | #168 | Good 1.9% |
| Vietnamese | 54.8 /100 | #169 | Average 1.9% |
| Costa Ricans | 53.3 /100 | #170 | Average 1.8% |