Immigrants from India vs Macedonian Unemployment Among Ages 30 to 34 years
COMPARE
Immigrants from India
Macedonian
Unemployment Among Ages 30 to 34 years
Unemployment Among Ages 30 to 34 years Comparison
Immigrants from India
Macedonians
4.5%
UNEMPLOYMENT AMONG AGES 30 TO 34 YEARS
100.0/ 100
METRIC RATING
1st/ 347
METRIC RANK
5.5%
UNEMPLOYMENT AMONG AGES 30 TO 34 YEARS
47.1/ 100
METRIC RATING
178th/ 347
METRIC RANK
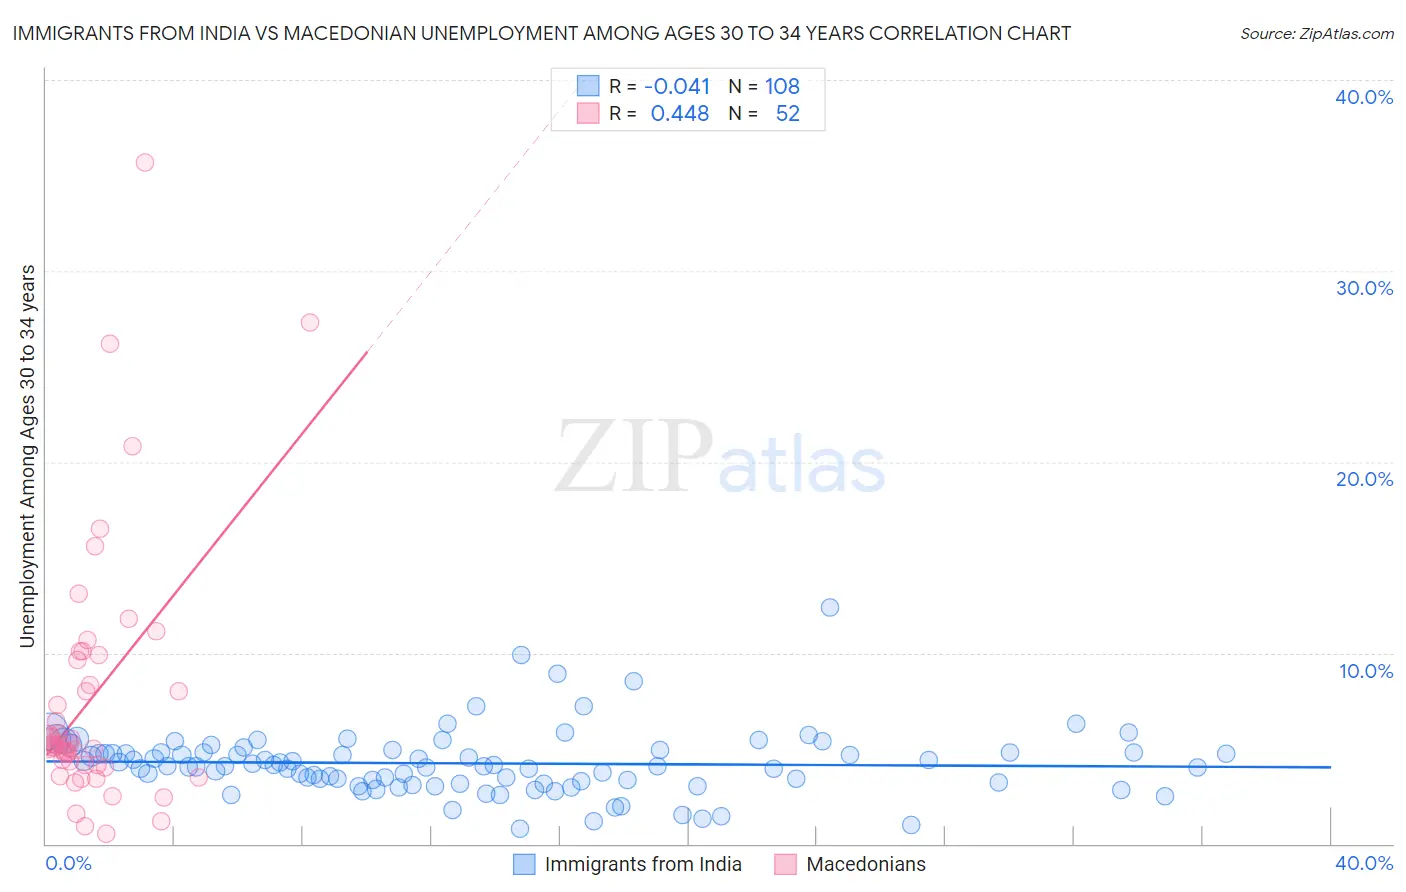
Immigrants from India vs Macedonian Unemployment Among Ages 30 to 34 years Correlation Chart
The statistical analysis conducted on geographies consisting of 406,040,304 people shows no correlation between the proportion of Immigrants from India and unemployment rate among population between the ages 30 and 34 in the United States with a correlation coefficient (R) of -0.041 and weighted average of 4.5%. Similarly, the statistical analysis conducted on geographies consisting of 128,261,818 people shows a moderate positive correlation between the proportion of Macedonians and unemployment rate among population between the ages 30 and 34 in the United States with a correlation coefficient (R) of 0.448 and weighted average of 5.5%, a difference of 22.0%.
Unemployment Among Ages 30 to 34 years Correlation Summary
| Measurement | Immigrants from India | Macedonian |
| Minimum | 0.80% | 0.50% |
| Maximum | 12.4% | 35.7% |
| Range | 11.6% | 35.2% |
| Mean | 4.2% | 7.7% |
| Median | 4.1% | 5.2% |
| Interquartile 25% (IQ1) | 3.2% | 4.1% |
| Interquartile 75% (IQ3) | 4.8% | 9.8% |
| Interquartile Range (IQR) | 1.6% | 5.7% |
| Standard Deviation (Sample) | 1.7% | 6.9% |
| Standard Deviation (Population) | 1.7% | 6.8% |
Similar Demographics by Unemployment Among Ages 30 to 34 years
Demographics Similar to Immigrants from India by Unemployment Among Ages 30 to 34 years
In terms of unemployment among ages 30 to 34 years, the demographic groups most similar to Immigrants from India are Sudanese (4.6%, a difference of 1.8%), Immigrants from Venezuela (4.6%, a difference of 3.5%), Immigrants from Nepal (4.7%, a difference of 4.2%), Venezuelan (4.7%, a difference of 4.8%), and Immigrants from Bosnia and Herzegovina (4.7%, a difference of 5.1%).
| Demographics | Rating | Rank | Unemployment Among Ages 30 to 34 years |
| Immigrants | India | 100.0 /100 | #1 | Exceptional 4.5% |
| Sudanese | 100.0 /100 | #2 | Exceptional 4.6% |
| Immigrants | Venezuela | 100.0 /100 | #3 | Exceptional 4.6% |
| Immigrants | Nepal | 100.0 /100 | #4 | Exceptional 4.7% |
| Venezuelans | 100.0 /100 | #5 | Exceptional 4.7% |
| Immigrants | Bosnia and Herzegovina | 100.0 /100 | #6 | Exceptional 4.7% |
| Thais | 100.0 /100 | #7 | Exceptional 4.7% |
| Immigrants | Eritrea | 100.0 /100 | #8 | Exceptional 4.7% |
| Bulgarians | 99.9 /100 | #9 | Exceptional 4.7% |
| Tongans | 99.9 /100 | #10 | Exceptional 4.8% |
| Immigrants | Bolivia | 99.9 /100 | #11 | Exceptional 4.8% |
| Filipinos | 99.9 /100 | #12 | Exceptional 4.8% |
| Cambodians | 99.9 /100 | #13 | Exceptional 4.8% |
| Luxembourgers | 99.9 /100 | #14 | Exceptional 4.8% |
| Okinawans | 99.9 /100 | #15 | Exceptional 4.8% |
Demographics Similar to Macedonians by Unemployment Among Ages 30 to 34 years
In terms of unemployment among ages 30 to 34 years, the demographic groups most similar to Macedonians are Costa Rican (5.5%, a difference of 0.020%), Immigrants from Ukraine (5.5%, a difference of 0.050%), Immigrants from Peru (5.5%, a difference of 0.070%), Italian (5.5%, a difference of 0.11%), and Afghan (5.5%, a difference of 0.18%).
| Demographics | Rating | Rank | Unemployment Among Ages 30 to 34 years |
| Scottish | 51.8 /100 | #171 | Average 5.5% |
| Immigrants | Austria | 51.3 /100 | #172 | Average 5.5% |
| Peruvians | 50.2 /100 | #173 | Average 5.5% |
| Immigrants | Laos | 50.0 /100 | #174 | Average 5.5% |
| Afghans | 49.6 /100 | #175 | Average 5.5% |
| Immigrants | Peru | 48.0 /100 | #176 | Average 5.5% |
| Immigrants | Ukraine | 47.7 /100 | #177 | Average 5.5% |
| Macedonians | 47.1 /100 | #178 | Average 5.5% |
| Costa Ricans | 46.7 /100 | #179 | Average 5.5% |
| Italians | 45.5 /100 | #180 | Average 5.5% |
| Immigrants | Lebanon | 43.5 /100 | #181 | Average 5.5% |
| Immigrants | Denmark | 43.4 /100 | #182 | Average 5.5% |
| Hungarians | 43.1 /100 | #183 | Average 5.5% |
| Malaysians | 41.8 /100 | #184 | Average 5.5% |
| Immigrants | Western Europe | 39.1 /100 | #185 | Fair 5.5% |