Immigrants from Hong Kong vs Puerto Rican No Schooling Completed
COMPARE
Immigrants from Hong Kong
Puerto Rican
No Schooling Completed
No Schooling Completed Comparison
Immigrants from Hong Kong
Puerto Ricans
2.7%
NO SCHOOLING COMPLETED
0.0/ 100
METRIC RATING
290th/ 347
METRIC RANK
2.3%
NO SCHOOLING COMPLETED
3.4/ 100
METRIC RATING
230th/ 347
METRIC RANK
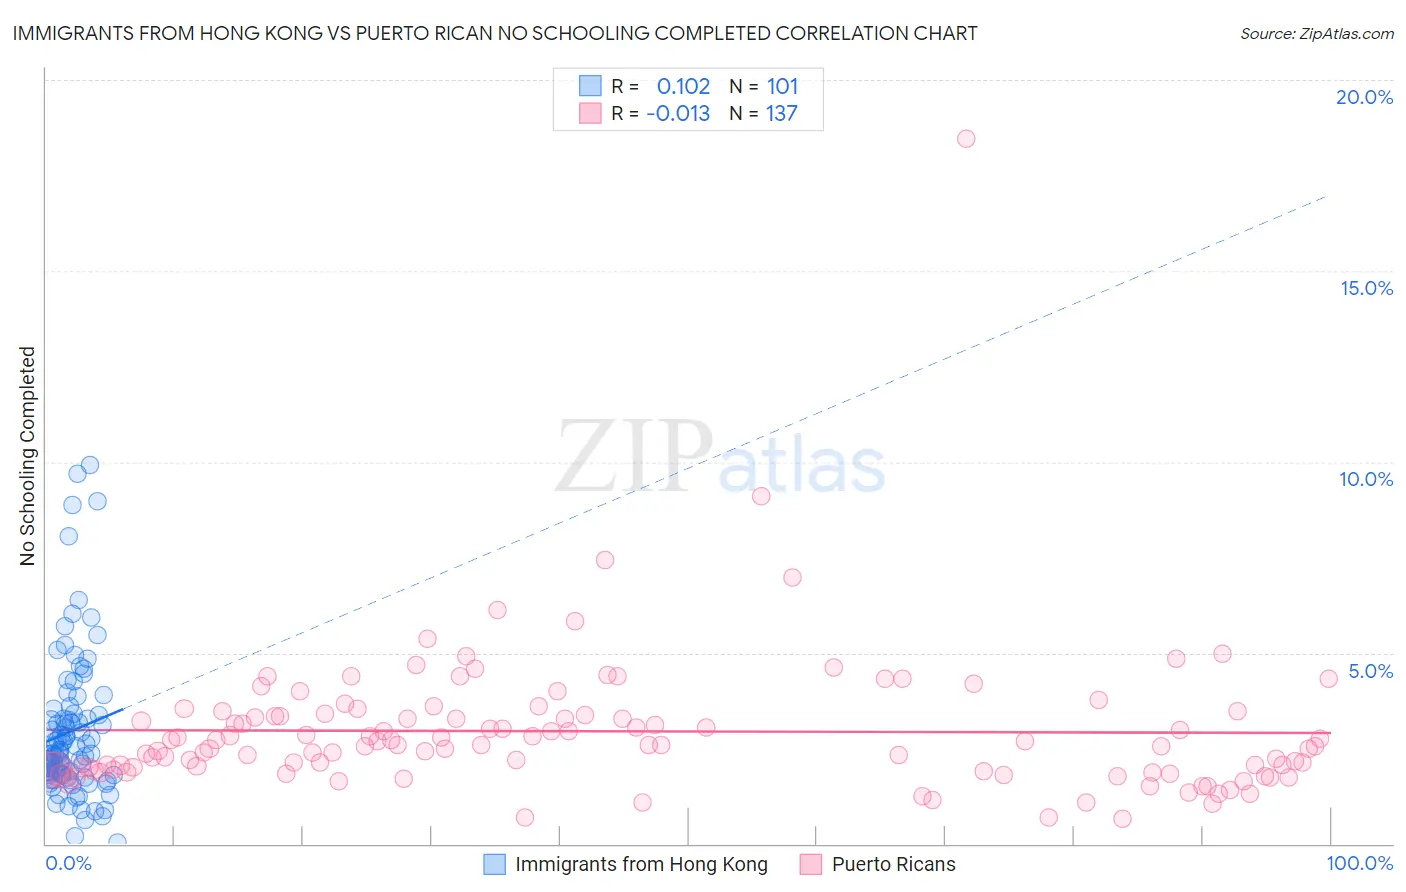
Immigrants from Hong Kong vs Puerto Rican No Schooling Completed Correlation Chart
The statistical analysis conducted on geographies consisting of 252,436,459 people shows a poor positive correlation between the proportion of Immigrants from Hong Kong and percentage of population with no schooling in the United States with a correlation coefficient (R) of 0.102 and weighted average of 2.7%. Similarly, the statistical analysis conducted on geographies consisting of 518,442,675 people shows no correlation between the proportion of Puerto Ricans and percentage of population with no schooling in the United States with a correlation coefficient (R) of -0.013 and weighted average of 2.3%, a difference of 16.2%.
No Schooling Completed Correlation Summary
| Measurement | Immigrants from Hong Kong | Puerto Rican |
| Minimum | 0.020% | 0.67% |
| Maximum | 9.9% | 18.5% |
| Range | 9.9% | 17.8% |
| Mean | 3.0% | 2.9% |
| Median | 2.4% | 2.6% |
| Interquartile 25% (IQ1) | 1.8% | 1.9% |
| Interquartile 75% (IQ3) | 3.4% | 3.4% |
| Interquartile Range (IQR) | 1.6% | 1.5% |
| Standard Deviation (Sample) | 1.9% | 1.9% |
| Standard Deviation (Population) | 1.9% | 1.9% |
Similar Demographics by No Schooling Completed
Demographics Similar to Immigrants from Hong Kong by No Schooling Completed
In terms of no schooling completed, the demographic groups most similar to Immigrants from Hong Kong are Immigrants from Thailand (2.7%, a difference of 0.060%), Immigrants from St. Vincent and the Grenadines (2.7%, a difference of 0.38%), Immigrants from Afghanistan (2.7%, a difference of 0.48%), British West Indian (2.7%, a difference of 0.89%), and Immigrants from Portugal (2.7%, a difference of 1.3%).
| Demographics | Rating | Rank | No Schooling Completed |
| Immigrants | Trinidad and Tobago | 0.0 /100 | #283 | Tragic 2.6% |
| Immigrants | West Indies | 0.0 /100 | #284 | Tragic 2.7% |
| Immigrants | Barbados | 0.0 /100 | #285 | Tragic 2.7% |
| Immigrants | Portugal | 0.0 /100 | #286 | Tragic 2.7% |
| Immigrants | Afghanistan | 0.0 /100 | #287 | Tragic 2.7% |
| Immigrants | St. Vincent and the Grenadines | 0.0 /100 | #288 | Tragic 2.7% |
| Immigrants | Thailand | 0.0 /100 | #289 | Tragic 2.7% |
| Immigrants | Hong Kong | 0.0 /100 | #290 | Tragic 2.7% |
| British West Indians | 0.0 /100 | #291 | Tragic 2.7% |
| Immigrants | Grenada | 0.0 /100 | #292 | Tragic 2.8% |
| Malaysians | 0.0 /100 | #293 | Tragic 2.8% |
| Immigrants | Eritrea | 0.0 /100 | #294 | Tragic 2.8% |
| Houma | 0.0 /100 | #295 | Tragic 2.8% |
| Immigrants | Immigrants | 0.0 /100 | #296 | Tragic 2.8% |
| Immigrants | Cuba | 0.0 /100 | #297 | Tragic 2.8% |
Demographics Similar to Puerto Ricans by No Schooling Completed
In terms of no schooling completed, the demographic groups most similar to Puerto Ricans are Immigrants from Uruguay (2.3%, a difference of 0.020%), Immigrants from Pakistan (2.3%, a difference of 0.13%), U.S. Virgin Islander (2.3%, a difference of 0.22%), Colombian (2.3%, a difference of 0.25%), and Immigrants from Uganda (2.3%, a difference of 0.51%).
| Demographics | Rating | Rank | No Schooling Completed |
| Immigrants | Lebanon | 4.5 /100 | #223 | Tragic 2.3% |
| Tohono O'odham | 4.1 /100 | #224 | Tragic 2.3% |
| Sudanese | 4.1 /100 | #225 | Tragic 2.3% |
| Sierra Leoneans | 4.1 /100 | #226 | Tragic 2.3% |
| Immigrants | Uganda | 4.0 /100 | #227 | Tragic 2.3% |
| U.S. Virgin Islanders | 3.7 /100 | #228 | Tragic 2.3% |
| Immigrants | Pakistan | 3.6 /100 | #229 | Tragic 2.3% |
| Puerto Ricans | 3.4 /100 | #230 | Tragic 2.3% |
| Immigrants | Uruguay | 3.4 /100 | #231 | Tragic 2.3% |
| Colombians | 3.2 /100 | #232 | Tragic 2.3% |
| Immigrants | Malaysia | 2.8 /100 | #233 | Tragic 2.3% |
| Nigerians | 2.6 /100 | #234 | Tragic 2.3% |
| Immigrants | Western Asia | 2.6 /100 | #235 | Tragic 2.3% |
| Iraqis | 2.2 /100 | #236 | Tragic 2.4% |
| Immigrants | Eastern Asia | 2.0 /100 | #237 | Tragic 2.4% |