Basque vs Puerto Rican No Schooling Completed
COMPARE
Basque
Puerto Rican
No Schooling Completed
No Schooling Completed Comparison
Basques
Puerto Ricans
1.8%
NO SCHOOLING COMPLETED
97.9/ 100
METRIC RATING
103rd/ 347
METRIC RANK
2.3%
NO SCHOOLING COMPLETED
3.4/ 100
METRIC RATING
230th/ 347
METRIC RANK
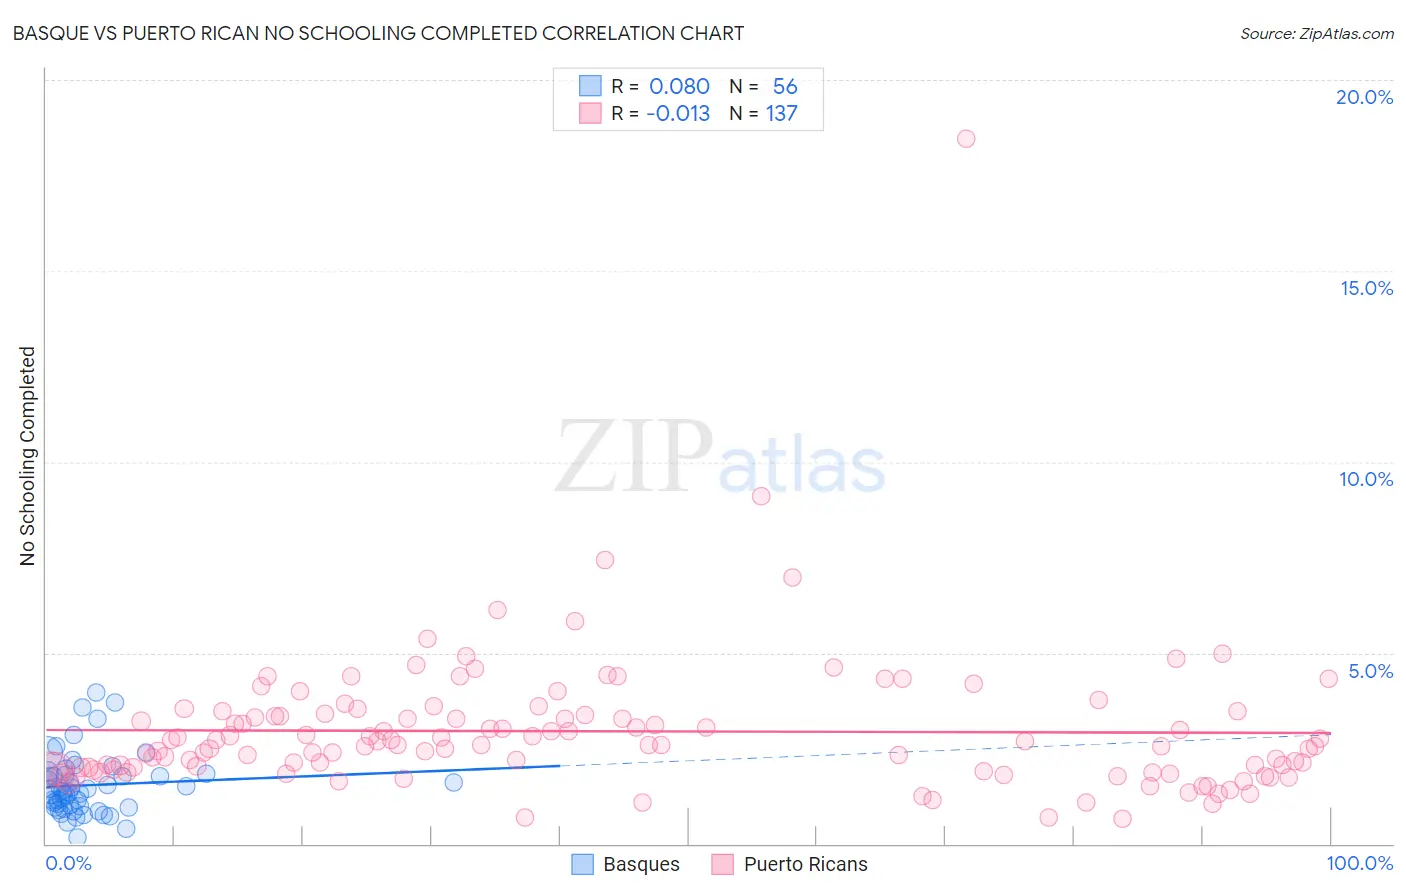
Basque vs Puerto Rican No Schooling Completed Correlation Chart
The statistical analysis conducted on geographies consisting of 164,919,642 people shows a slight positive correlation between the proportion of Basques and percentage of population with no schooling in the United States with a correlation coefficient (R) of 0.080 and weighted average of 1.8%. Similarly, the statistical analysis conducted on geographies consisting of 518,442,675 people shows no correlation between the proportion of Puerto Ricans and percentage of population with no schooling in the United States with a correlation coefficient (R) of -0.013 and weighted average of 2.3%, a difference of 27.6%.
No Schooling Completed Correlation Summary
| Measurement | Basque | Puerto Rican |
| Minimum | 0.17% | 0.67% |
| Maximum | 4.0% | 18.5% |
| Range | 3.8% | 17.8% |
| Mean | 1.5% | 2.9% |
| Median | 1.4% | 2.6% |
| Interquartile 25% (IQ1) | 0.96% | 1.9% |
| Interquartile 75% (IQ3) | 1.8% | 3.4% |
| Interquartile Range (IQR) | 0.85% | 1.5% |
| Standard Deviation (Sample) | 0.80% | 1.9% |
| Standard Deviation (Population) | 0.79% | 1.9% |
Similar Demographics by No Schooling Completed
Demographics Similar to Basques by No Schooling Completed
In terms of no schooling completed, the demographic groups most similar to Basques are Immigrants from Switzerland (1.8%, a difference of 0.050%), Immigrants from Czechoslovakia (1.8%, a difference of 0.060%), Immigrants from Singapore (1.8%, a difference of 0.35%), Choctaw (1.8%, a difference of 0.55%), and Thai (1.8%, a difference of 0.57%).
| Demographics | Rating | Rank | No Schooling Completed |
| Bhutanese | 98.4 /100 | #96 | Exceptional 1.8% |
| Immigrants | Ireland | 98.4 /100 | #97 | Exceptional 1.8% |
| Iranians | 98.2 /100 | #98 | Exceptional 1.8% |
| Choctaw | 98.1 /100 | #99 | Exceptional 1.8% |
| Immigrants | Singapore | 98.0 /100 | #100 | Exceptional 1.8% |
| Immigrants | Czechoslovakia | 97.9 /100 | #101 | Exceptional 1.8% |
| Immigrants | Switzerland | 97.9 /100 | #102 | Exceptional 1.8% |
| Basques | 97.9 /100 | #103 | Exceptional 1.8% |
| Thais | 97.5 /100 | #104 | Exceptional 1.8% |
| German Russians | 97.5 /100 | #105 | Exceptional 1.8% |
| Immigrants | France | 97.3 /100 | #106 | Exceptional 1.8% |
| Yugoslavians | 97.2 /100 | #107 | Exceptional 1.8% |
| Okinawans | 97.1 /100 | #108 | Exceptional 1.8% |
| Immigrants | Saudi Arabia | 96.8 /100 | #109 | Exceptional 1.9% |
| Immigrants | Latvia | 96.7 /100 | #110 | Exceptional 1.9% |
Demographics Similar to Puerto Ricans by No Schooling Completed
In terms of no schooling completed, the demographic groups most similar to Puerto Ricans are Immigrants from Uruguay (2.3%, a difference of 0.020%), Immigrants from Pakistan (2.3%, a difference of 0.13%), U.S. Virgin Islander (2.3%, a difference of 0.22%), Colombian (2.3%, a difference of 0.25%), and Immigrants from Uganda (2.3%, a difference of 0.51%).
| Demographics | Rating | Rank | No Schooling Completed |
| Immigrants | Lebanon | 4.5 /100 | #223 | Tragic 2.3% |
| Tohono O'odham | 4.1 /100 | #224 | Tragic 2.3% |
| Sudanese | 4.1 /100 | #225 | Tragic 2.3% |
| Sierra Leoneans | 4.1 /100 | #226 | Tragic 2.3% |
| Immigrants | Uganda | 4.0 /100 | #227 | Tragic 2.3% |
| U.S. Virgin Islanders | 3.7 /100 | #228 | Tragic 2.3% |
| Immigrants | Pakistan | 3.6 /100 | #229 | Tragic 2.3% |
| Puerto Ricans | 3.4 /100 | #230 | Tragic 2.3% |
| Immigrants | Uruguay | 3.4 /100 | #231 | Tragic 2.3% |
| Colombians | 3.2 /100 | #232 | Tragic 2.3% |
| Immigrants | Malaysia | 2.8 /100 | #233 | Tragic 2.3% |
| Nigerians | 2.6 /100 | #234 | Tragic 2.3% |
| Immigrants | Western Asia | 2.6 /100 | #235 | Tragic 2.3% |
| Iraqis | 2.2 /100 | #236 | Tragic 2.4% |
| Immigrants | Eastern Asia | 2.0 /100 | #237 | Tragic 2.4% |