European vs Armenian Professional Degree
COMPARE
European
Armenian
Professional Degree
Professional Degree Comparison
Europeans
Armenians
4.8%
PROFESSIONAL DEGREE
93.2/ 100
METRIC RATING
126th/ 347
METRIC RANK
5.3%
PROFESSIONAL DEGREE
99.7/ 100
METRIC RATING
78th/ 347
METRIC RANK
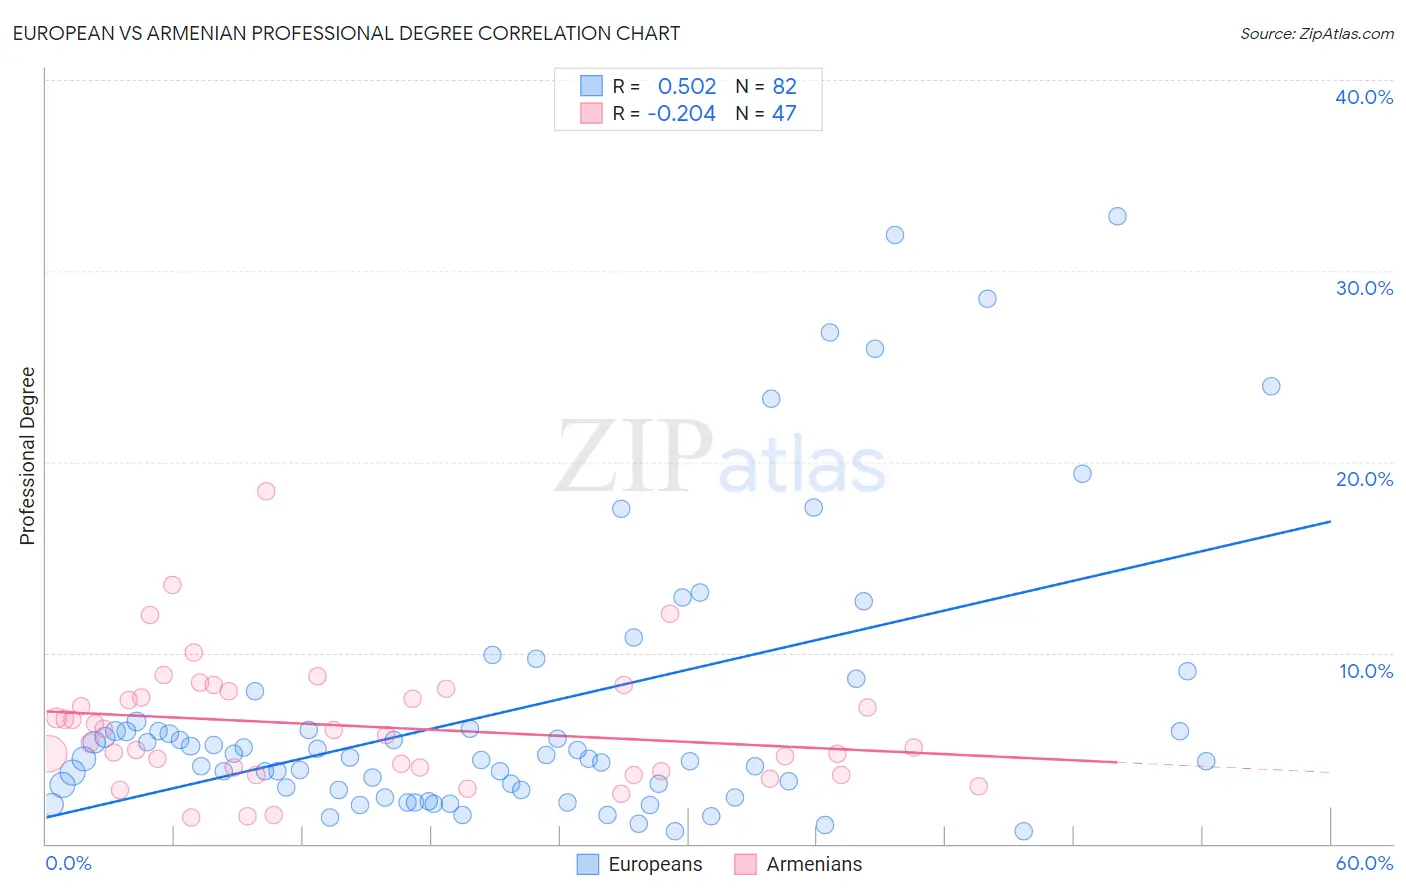
European vs Armenian Professional Degree Correlation Chart
The statistical analysis conducted on geographies consisting of 555,066,624 people shows a substantial positive correlation between the proportion of Europeans and percentage of population with at least professional degree education in the United States with a correlation coefficient (R) of 0.502 and weighted average of 4.8%. Similarly, the statistical analysis conducted on geographies consisting of 310,624,629 people shows a weak negative correlation between the proportion of Armenians and percentage of population with at least professional degree education in the United States with a correlation coefficient (R) of -0.204 and weighted average of 5.3%, a difference of 10.7%.
Professional Degree Correlation Summary
| Measurement | European | Armenian |
| Minimum | 0.65% | 1.4% |
| Maximum | 32.8% | 18.5% |
| Range | 32.2% | 17.1% |
| Mean | 7.0% | 6.2% |
| Median | 4.5% | 5.7% |
| Interquartile 25% (IQ1) | 2.8% | 3.8% |
| Interquartile 75% (IQ3) | 6.0% | 8.0% |
| Interquartile Range (IQR) | 3.2% | 4.1% |
| Standard Deviation (Sample) | 7.4% | 3.3% |
| Standard Deviation (Population) | 7.3% | 3.3% |
Similar Demographics by Professional Degree
Demographics Similar to Europeans by Professional Degree
In terms of professional degree, the demographic groups most similar to Europeans are Immigrants from Albania (4.8%, a difference of 0.050%), Immigrants from Eritrea (4.8%, a difference of 0.17%), Serbian (4.8%, a difference of 0.30%), Immigrants from Eastern Africa (4.8%, a difference of 0.32%), and Immigrants from Venezuela (4.8%, a difference of 0.36%).
| Demographics | Rating | Rank | Professional Degree |
| Immigrants | Sudan | 95.4 /100 | #119 | Exceptional 4.9% |
| Albanians | 95.3 /100 | #120 | Exceptional 4.9% |
| Immigrants | Moldova | 94.8 /100 | #121 | Exceptional 4.9% |
| Immigrants | Germany | 94.1 /100 | #122 | Exceptional 4.9% |
| Immigrants | Venezuela | 93.8 /100 | #123 | Exceptional 4.8% |
| Immigrants | Eritrea | 93.5 /100 | #124 | Exceptional 4.8% |
| Immigrants | Albania | 93.3 /100 | #125 | Exceptional 4.8% |
| Europeans | 93.2 /100 | #126 | Exceptional 4.8% |
| Serbians | 92.6 /100 | #127 | Exceptional 4.8% |
| Immigrants | Eastern Africa | 92.5 /100 | #128 | Exceptional 4.8% |
| Palestinians | 91.5 /100 | #129 | Exceptional 4.8% |
| Icelanders | 91.5 /100 | #130 | Exceptional 4.8% |
| Immigrants | Nepal | 91.4 /100 | #131 | Exceptional 4.8% |
| Pakistanis | 90.9 /100 | #132 | Exceptional 4.8% |
| Italians | 90.2 /100 | #133 | Exceptional 4.8% |
Demographics Similar to Armenians by Professional Degree
In terms of professional degree, the demographic groups most similar to Armenians are Immigrants from Ethiopia (5.3%, a difference of 0.050%), Immigrants from Canada (5.3%, a difference of 0.090%), Immigrants from Indonesia (5.3%, a difference of 0.17%), Immigrants from North America (5.3%, a difference of 0.17%), and Ethiopian (5.4%, a difference of 0.30%).
| Demographics | Rating | Rank | Professional Degree |
| Immigrants | Western Asia | 99.8 /100 | #71 | Exceptional 5.4% |
| Lithuanians | 99.8 /100 | #72 | Exceptional 5.4% |
| Immigrants | Romania | 99.8 /100 | #73 | Exceptional 5.4% |
| Ethiopians | 99.7 /100 | #74 | Exceptional 5.4% |
| Immigrants | Indonesia | 99.7 /100 | #75 | Exceptional 5.3% |
| Immigrants | Canada | 99.7 /100 | #76 | Exceptional 5.3% |
| Immigrants | Ethiopia | 99.7 /100 | #77 | Exceptional 5.3% |
| Armenians | 99.7 /100 | #78 | Exceptional 5.3% |
| Immigrants | North America | 99.7 /100 | #79 | Exceptional 5.3% |
| Immigrants | England | 99.6 /100 | #80 | Exceptional 5.3% |
| Immigrants | Brazil | 99.6 /100 | #81 | Exceptional 5.3% |
| Romanians | 99.6 /100 | #82 | Exceptional 5.3% |
| Carpatho Rusyns | 99.6 /100 | #83 | Exceptional 5.3% |
| Immigrants | Croatia | 99.6 /100 | #84 | Exceptional 5.3% |
| Immigrants | Zimbabwe | 99.6 /100 | #85 | Exceptional 5.3% |