French vs Armenian Professional Degree
COMPARE
French
Armenian
Professional Degree
Professional Degree Comparison
French
Armenians
4.2%
PROFESSIONAL DEGREE
27.1/ 100
METRIC RATING
193rd/ 347
METRIC RANK
5.3%
PROFESSIONAL DEGREE
99.7/ 100
METRIC RATING
78th/ 347
METRIC RANK
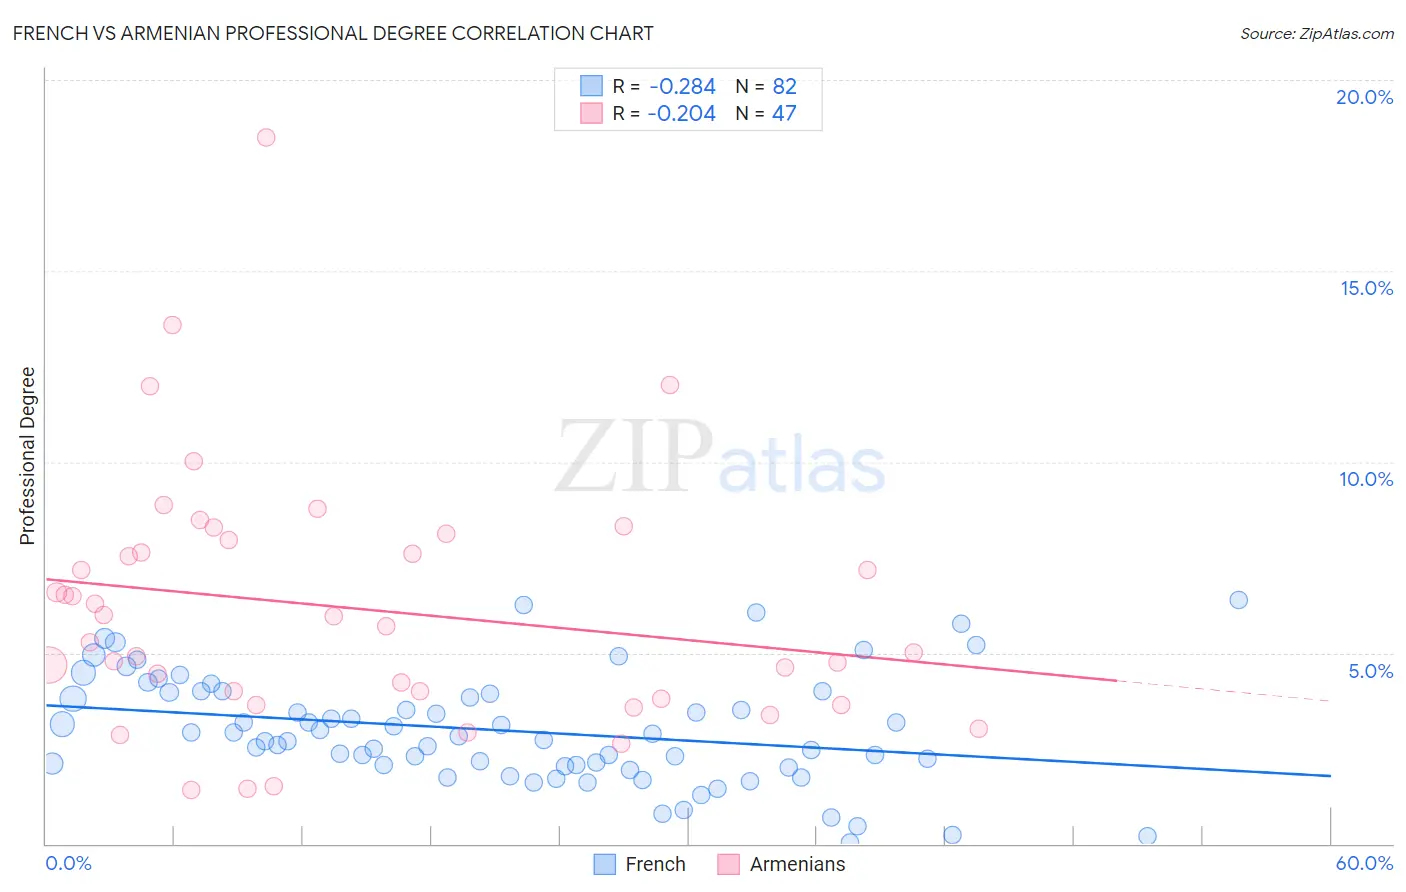
French vs Armenian Professional Degree Correlation Chart
The statistical analysis conducted on geographies consisting of 564,087,067 people shows a weak negative correlation between the proportion of French and percentage of population with at least professional degree education in the United States with a correlation coefficient (R) of -0.284 and weighted average of 4.2%. Similarly, the statistical analysis conducted on geographies consisting of 310,624,629 people shows a weak negative correlation between the proportion of Armenians and percentage of population with at least professional degree education in the United States with a correlation coefficient (R) of -0.204 and weighted average of 5.3%, a difference of 25.7%.
Professional Degree Correlation Summary
| Measurement | French | Armenian |
| Minimum | 0.047% | 1.4% |
| Maximum | 6.4% | 18.5% |
| Range | 6.4% | 17.1% |
| Mean | 3.0% | 6.2% |
| Median | 2.8% | 5.7% |
| Interquartile 25% (IQ1) | 2.1% | 3.8% |
| Interquartile 75% (IQ3) | 4.0% | 8.0% |
| Interquartile Range (IQR) | 1.9% | 4.1% |
| Standard Deviation (Sample) | 1.4% | 3.3% |
| Standard Deviation (Population) | 1.4% | 3.3% |
Similar Demographics by Professional Degree
Demographics Similar to French by Professional Degree
In terms of professional degree, the demographic groups most similar to French are Ghanaian (4.3%, a difference of 0.040%), Scandinavian (4.2%, a difference of 0.25%), Sri Lankan (4.3%, a difference of 0.37%), Immigrants from Poland (4.3%, a difference of 0.40%), and Nigerian (4.2%, a difference of 0.49%).
| Demographics | Rating | Rank | Professional Degree |
| Scotch-Irish | 34.2 /100 | #186 | Fair 4.3% |
| Immigrants | Cameroon | 33.3 /100 | #187 | Fair 4.3% |
| Immigrants | Thailand | 31.7 /100 | #188 | Fair 4.3% |
| Slovaks | 30.7 /100 | #189 | Fair 4.3% |
| Immigrants | Poland | 29.2 /100 | #190 | Fair 4.3% |
| Sri Lankans | 29.0 /100 | #191 | Fair 4.3% |
| Ghanaians | 27.3 /100 | #192 | Fair 4.3% |
| French | 27.1 /100 | #193 | Fair 4.2% |
| Scandinavians | 25.8 /100 | #194 | Fair 4.2% |
| Nigerians | 24.6 /100 | #195 | Fair 4.2% |
| Spanish | 23.0 /100 | #196 | Fair 4.2% |
| Czechoslovakians | 22.4 /100 | #197 | Fair 4.2% |
| Immigrants | Middle Africa | 22.1 /100 | #198 | Fair 4.2% |
| Norwegians | 20.5 /100 | #199 | Fair 4.2% |
| Immigrants | North Macedonia | 20.2 /100 | #200 | Fair 4.2% |
Demographics Similar to Armenians by Professional Degree
In terms of professional degree, the demographic groups most similar to Armenians are Immigrants from Ethiopia (5.3%, a difference of 0.050%), Immigrants from Canada (5.3%, a difference of 0.090%), Immigrants from Indonesia (5.3%, a difference of 0.17%), Immigrants from North America (5.3%, a difference of 0.17%), and Ethiopian (5.4%, a difference of 0.30%).
| Demographics | Rating | Rank | Professional Degree |
| Immigrants | Western Asia | 99.8 /100 | #71 | Exceptional 5.4% |
| Lithuanians | 99.8 /100 | #72 | Exceptional 5.4% |
| Immigrants | Romania | 99.8 /100 | #73 | Exceptional 5.4% |
| Ethiopians | 99.7 /100 | #74 | Exceptional 5.4% |
| Immigrants | Indonesia | 99.7 /100 | #75 | Exceptional 5.3% |
| Immigrants | Canada | 99.7 /100 | #76 | Exceptional 5.3% |
| Immigrants | Ethiopia | 99.7 /100 | #77 | Exceptional 5.3% |
| Armenians | 99.7 /100 | #78 | Exceptional 5.3% |
| Immigrants | North America | 99.7 /100 | #79 | Exceptional 5.3% |
| Immigrants | England | 99.6 /100 | #80 | Exceptional 5.3% |
| Immigrants | Brazil | 99.6 /100 | #81 | Exceptional 5.3% |
| Romanians | 99.6 /100 | #82 | Exceptional 5.3% |
| Carpatho Rusyns | 99.6 /100 | #83 | Exceptional 5.3% |
| Immigrants | Croatia | 99.6 /100 | #84 | Exceptional 5.3% |
| Immigrants | Zimbabwe | 99.6 /100 | #85 | Exceptional 5.3% |