Immigrants from Haiti vs Palestinian 4th Grade
COMPARE
Immigrants from Haiti
Palestinian
4th Grade
4th Grade Comparison
Immigrants from Haiti
Palestinians
96.3%
4TH GRADE
0.0/ 100
METRIC RATING
307th/ 347
METRIC RANK
97.7%
4TH GRADE
88.1/ 100
METRIC RATING
134th/ 347
METRIC RANK
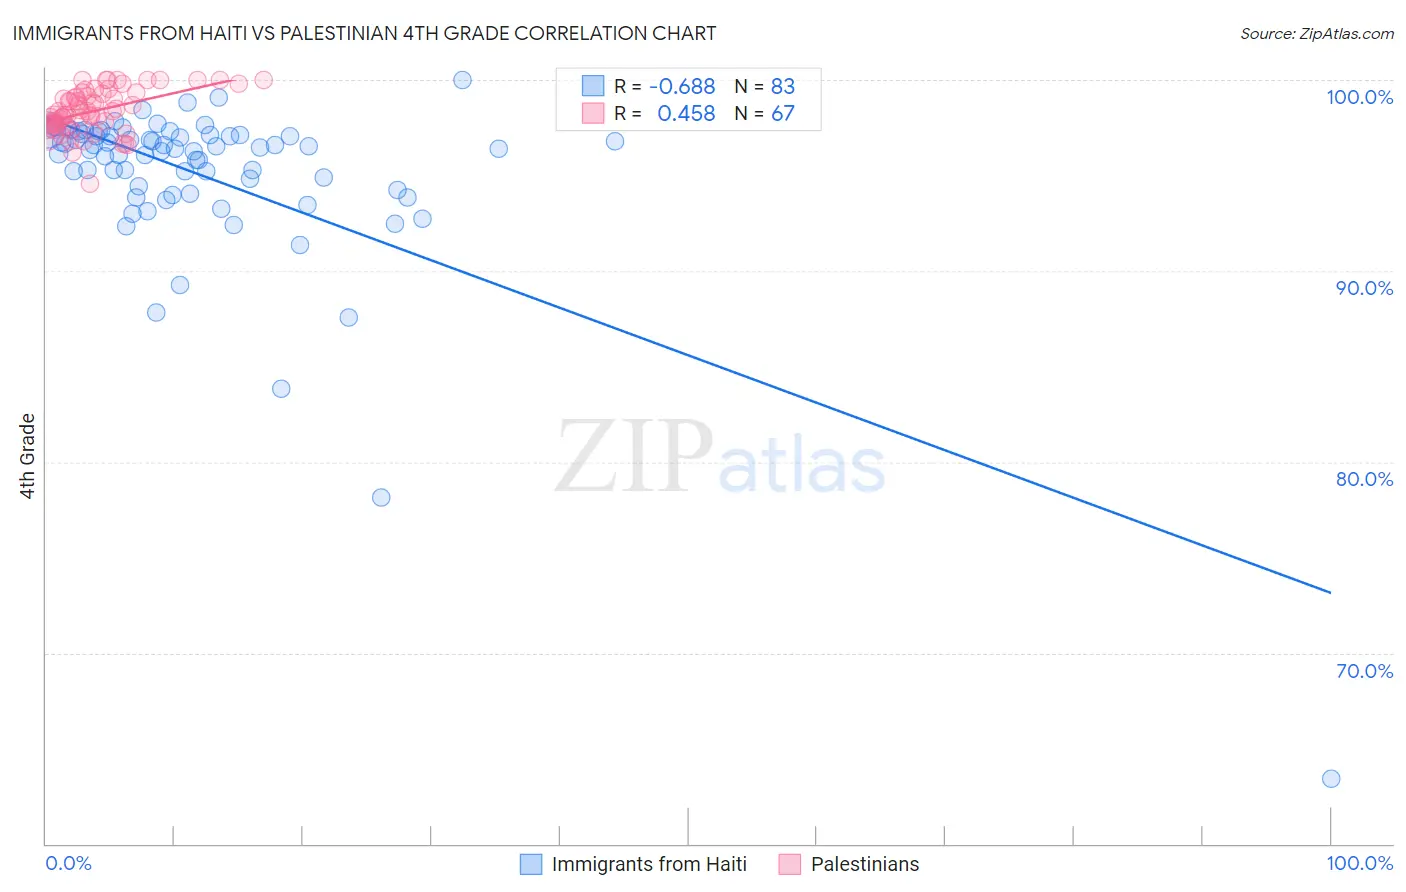
Immigrants from Haiti vs Palestinian 4th Grade Correlation Chart
The statistical analysis conducted on geographies consisting of 225,286,718 people shows a significant negative correlation between the proportion of Immigrants from Haiti and percentage of population with at least 4th grade education in the United States with a correlation coefficient (R) of -0.688 and weighted average of 96.3%. Similarly, the statistical analysis conducted on geographies consisting of 216,424,519 people shows a moderate positive correlation between the proportion of Palestinians and percentage of population with at least 4th grade education in the United States with a correlation coefficient (R) of 0.458 and weighted average of 97.7%, a difference of 1.4%.
4th Grade Correlation Summary
| Measurement | Immigrants from Haiti | Palestinian |
| Minimum | 63.4% | 94.6% |
| Maximum | 100.0% | 100.0% |
| Range | 36.6% | 5.4% |
| Mean | 95.0% | 98.4% |
| Median | 96.4% | 98.3% |
| Interquartile 25% (IQ1) | 94.2% | 97.7% |
| Interquartile 75% (IQ3) | 97.1% | 99.3% |
| Interquartile Range (IQR) | 2.9% | 1.6% |
| Standard Deviation (Sample) | 4.8% | 1.1% |
| Standard Deviation (Population) | 4.7% | 1.1% |
Similar Demographics by 4th Grade
Demographics Similar to Immigrants from Haiti by 4th Grade
In terms of 4th grade, the demographic groups most similar to Immigrants from Haiti are Immigrants from Laos (96.3%, a difference of 0.010%), Immigrants from Guyana (96.3%, a difference of 0.010%), Sri Lankan (96.4%, a difference of 0.030%), Immigrants from Caribbean (96.4%, a difference of 0.040%), and Immigrants from Burma/Myanmar (96.3%, a difference of 0.040%).
| Demographics | Rating | Rank | 4th Grade |
| Immigrants | South Eastern Asia | 0.0 /100 | #300 | Tragic 96.5% |
| Immigrants | Immigrants | 0.0 /100 | #301 | Tragic 96.5% |
| Immigrants | Cuba | 0.0 /100 | #302 | Tragic 96.4% |
| Guyanese | 0.0 /100 | #303 | Tragic 96.4% |
| Ecuadorians | 0.0 /100 | #304 | Tragic 96.4% |
| Immigrants | Caribbean | 0.0 /100 | #305 | Tragic 96.4% |
| Sri Lankans | 0.0 /100 | #306 | Tragic 96.4% |
| Immigrants | Haiti | 0.0 /100 | #307 | Tragic 96.3% |
| Immigrants | Laos | 0.0 /100 | #308 | Tragic 96.3% |
| Immigrants | Guyana | 0.0 /100 | #309 | Tragic 96.3% |
| Immigrants | Burma/Myanmar | 0.0 /100 | #310 | Tragic 96.3% |
| Immigrants | Bangladesh | 0.0 /100 | #311 | Tragic 96.2% |
| Cape Verdeans | 0.0 /100 | #312 | Tragic 96.2% |
| Indonesians | 0.0 /100 | #313 | Tragic 96.2% |
| Vietnamese | 0.0 /100 | #314 | Tragic 96.2% |
Demographics Similar to Palestinians by 4th Grade
In terms of 4th grade, the demographic groups most similar to Palestinians are Hmong (97.7%, a difference of 0.0%), Cambodian (97.7%, a difference of 0.0%), Immigrants from Hungary (97.7%, a difference of 0.010%), Immigrants from Romania (97.7%, a difference of 0.020%), and Immigrants from Kuwait (97.7%, a difference of 0.020%).
| Demographics | Rating | Rank | 4th Grade |
| Colville | 92.3 /100 | #127 | Exceptional 97.7% |
| Pima | 92.0 /100 | #128 | Exceptional 97.7% |
| Immigrants | Bulgaria | 91.3 /100 | #129 | Exceptional 97.7% |
| Immigrants | Romania | 90.6 /100 | #130 | Exceptional 97.7% |
| Immigrants | Kuwait | 89.7 /100 | #131 | Excellent 97.7% |
| Immigrants | Hungary | 89.3 /100 | #132 | Excellent 97.7% |
| Hmong | 88.2 /100 | #133 | Excellent 97.7% |
| Palestinians | 88.1 /100 | #134 | Excellent 97.7% |
| Cambodians | 87.8 /100 | #135 | Excellent 97.7% |
| Israelis | 86.2 /100 | #136 | Excellent 97.7% |
| Immigrants | Turkey | 86.0 /100 | #137 | Excellent 97.7% |
| Blackfeet | 86.0 /100 | #138 | Excellent 97.7% |
| Seminole | 84.7 /100 | #139 | Excellent 97.7% |
| Filipinos | 84.0 /100 | #140 | Excellent 97.7% |
| Immigrants | Greece | 83.8 /100 | #141 | Excellent 97.7% |