Immigrants from Haiti vs Celtic 4th Grade
COMPARE
Immigrants from Haiti
Celtic
4th Grade
4th Grade Comparison
Immigrants from Haiti
Celtics
96.3%
4TH GRADE
0.0/ 100
METRIC RATING
307th/ 347
METRIC RANK
98.1%
4TH GRADE
99.8/ 100
METRIC RATING
51st/ 347
METRIC RANK
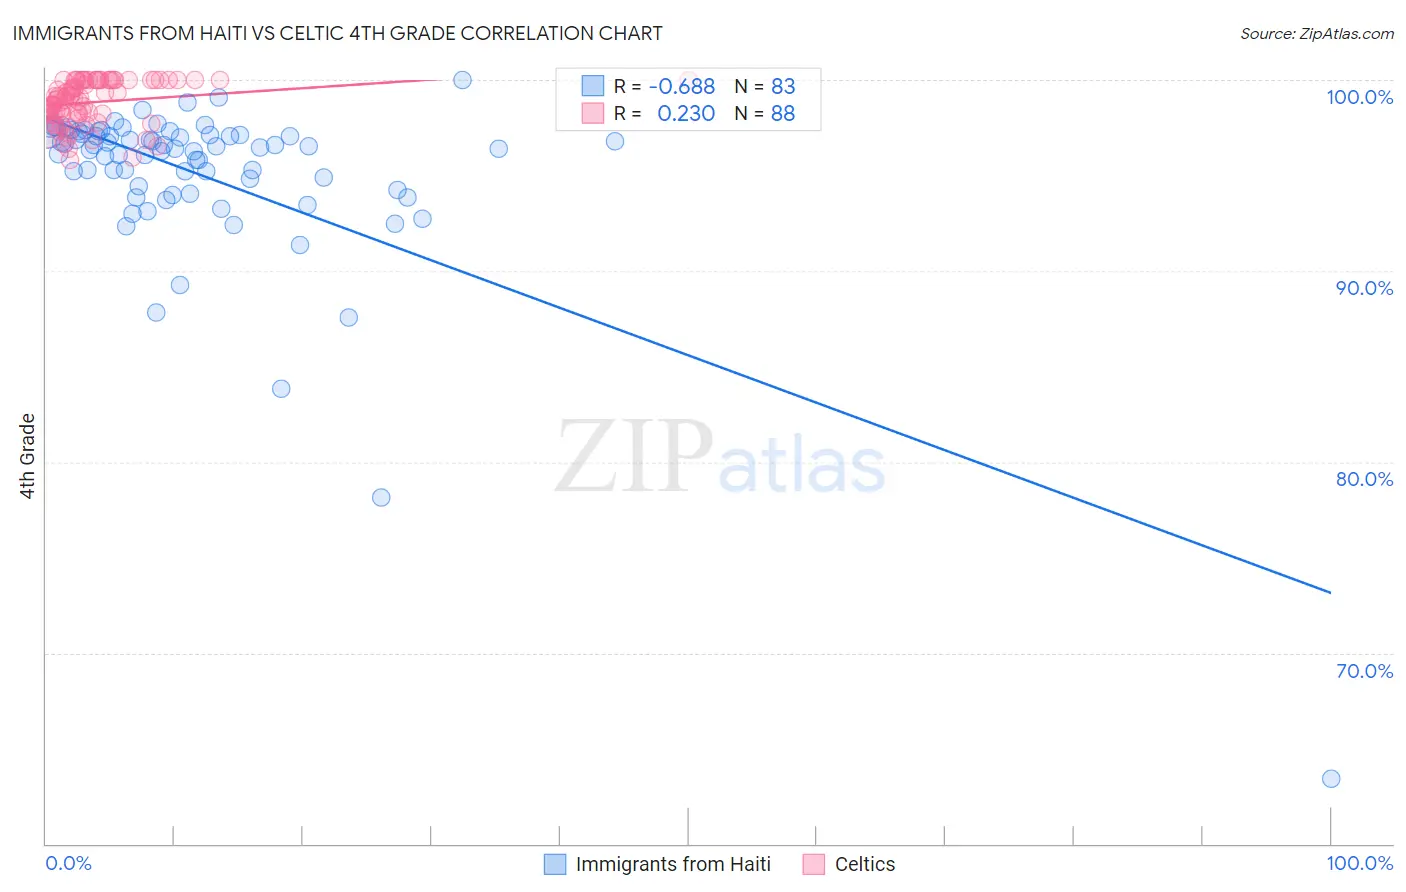
Immigrants from Haiti vs Celtic 4th Grade Correlation Chart
The statistical analysis conducted on geographies consisting of 225,286,718 people shows a significant negative correlation between the proportion of Immigrants from Haiti and percentage of population with at least 4th grade education in the United States with a correlation coefficient (R) of -0.688 and weighted average of 96.3%. Similarly, the statistical analysis conducted on geographies consisting of 168,875,705 people shows a weak positive correlation between the proportion of Celtics and percentage of population with at least 4th grade education in the United States with a correlation coefficient (R) of 0.230 and weighted average of 98.1%, a difference of 1.8%.
4th Grade Correlation Summary
| Measurement | Immigrants from Haiti | Celtic |
| Minimum | 63.4% | 95.8% |
| Maximum | 100.0% | 100.0% |
| Range | 36.6% | 4.2% |
| Mean | 95.0% | 98.8% |
| Median | 96.4% | 99.1% |
| Interquartile 25% (IQ1) | 94.2% | 98.2% |
| Interquartile 75% (IQ3) | 97.1% | 100.0% |
| Interquartile Range (IQR) | 2.9% | 1.8% |
| Standard Deviation (Sample) | 4.8% | 1.1% |
| Standard Deviation (Population) | 4.7% | 1.1% |
Similar Demographics by 4th Grade
Demographics Similar to Immigrants from Haiti by 4th Grade
In terms of 4th grade, the demographic groups most similar to Immigrants from Haiti are Immigrants from Laos (96.3%, a difference of 0.010%), Immigrants from Guyana (96.3%, a difference of 0.010%), Sri Lankan (96.4%, a difference of 0.030%), Immigrants from Caribbean (96.4%, a difference of 0.040%), and Immigrants from Burma/Myanmar (96.3%, a difference of 0.040%).
| Demographics | Rating | Rank | 4th Grade |
| Immigrants | South Eastern Asia | 0.0 /100 | #300 | Tragic 96.5% |
| Immigrants | Immigrants | 0.0 /100 | #301 | Tragic 96.5% |
| Immigrants | Cuba | 0.0 /100 | #302 | Tragic 96.4% |
| Guyanese | 0.0 /100 | #303 | Tragic 96.4% |
| Ecuadorians | 0.0 /100 | #304 | Tragic 96.4% |
| Immigrants | Caribbean | 0.0 /100 | #305 | Tragic 96.4% |
| Sri Lankans | 0.0 /100 | #306 | Tragic 96.4% |
| Immigrants | Haiti | 0.0 /100 | #307 | Tragic 96.3% |
| Immigrants | Laos | 0.0 /100 | #308 | Tragic 96.3% |
| Immigrants | Guyana | 0.0 /100 | #309 | Tragic 96.3% |
| Immigrants | Burma/Myanmar | 0.0 /100 | #310 | Tragic 96.3% |
| Immigrants | Bangladesh | 0.0 /100 | #311 | Tragic 96.2% |
| Cape Verdeans | 0.0 /100 | #312 | Tragic 96.2% |
| Indonesians | 0.0 /100 | #313 | Tragic 96.2% |
| Vietnamese | 0.0 /100 | #314 | Tragic 96.2% |
Demographics Similar to Celtics by 4th Grade
In terms of 4th grade, the demographic groups most similar to Celtics are Immigrants from Scotland (98.1%, a difference of 0.0%), Australian (98.1%, a difference of 0.0%), Estonian (98.1%, a difference of 0.010%), Bulgarian (98.1%, a difference of 0.010%), and Slavic (98.1%, a difference of 0.010%).
| Demographics | Rating | Rank | 4th Grade |
| Native Hawaiians | 99.9 /100 | #44 | Exceptional 98.1% |
| Czechoslovakians | 99.9 /100 | #45 | Exceptional 98.1% |
| Ottawa | 99.9 /100 | #46 | Exceptional 98.1% |
| Arapaho | 99.9 /100 | #47 | Exceptional 98.1% |
| Estonians | 99.8 /100 | #48 | Exceptional 98.1% |
| Bulgarians | 99.8 /100 | #49 | Exceptional 98.1% |
| Immigrants | Scotland | 99.8 /100 | #50 | Exceptional 98.1% |
| Celtics | 99.8 /100 | #51 | Exceptional 98.1% |
| Australians | 99.8 /100 | #52 | Exceptional 98.1% |
| Slavs | 99.8 /100 | #53 | Exceptional 98.1% |
| Maltese | 99.8 /100 | #54 | Exceptional 98.1% |
| Whites/Caucasians | 99.8 /100 | #55 | Exceptional 98.1% |
| Greeks | 99.8 /100 | #56 | Exceptional 98.1% |
| Austrians | 99.8 /100 | #57 | Exceptional 98.1% |
| Creek | 99.8 /100 | #58 | Exceptional 98.1% |