Immigrants from Haiti vs Immigrants from Israel 4th Grade
COMPARE
Immigrants from Haiti
Immigrants from Israel
4th Grade
4th Grade Comparison
Immigrants from Haiti
Immigrants from Israel
96.3%
4TH GRADE
0.0/ 100
METRIC RATING
307th/ 347
METRIC RANK
97.6%
4TH GRADE
77.7/ 100
METRIC RATING
150th/ 347
METRIC RANK
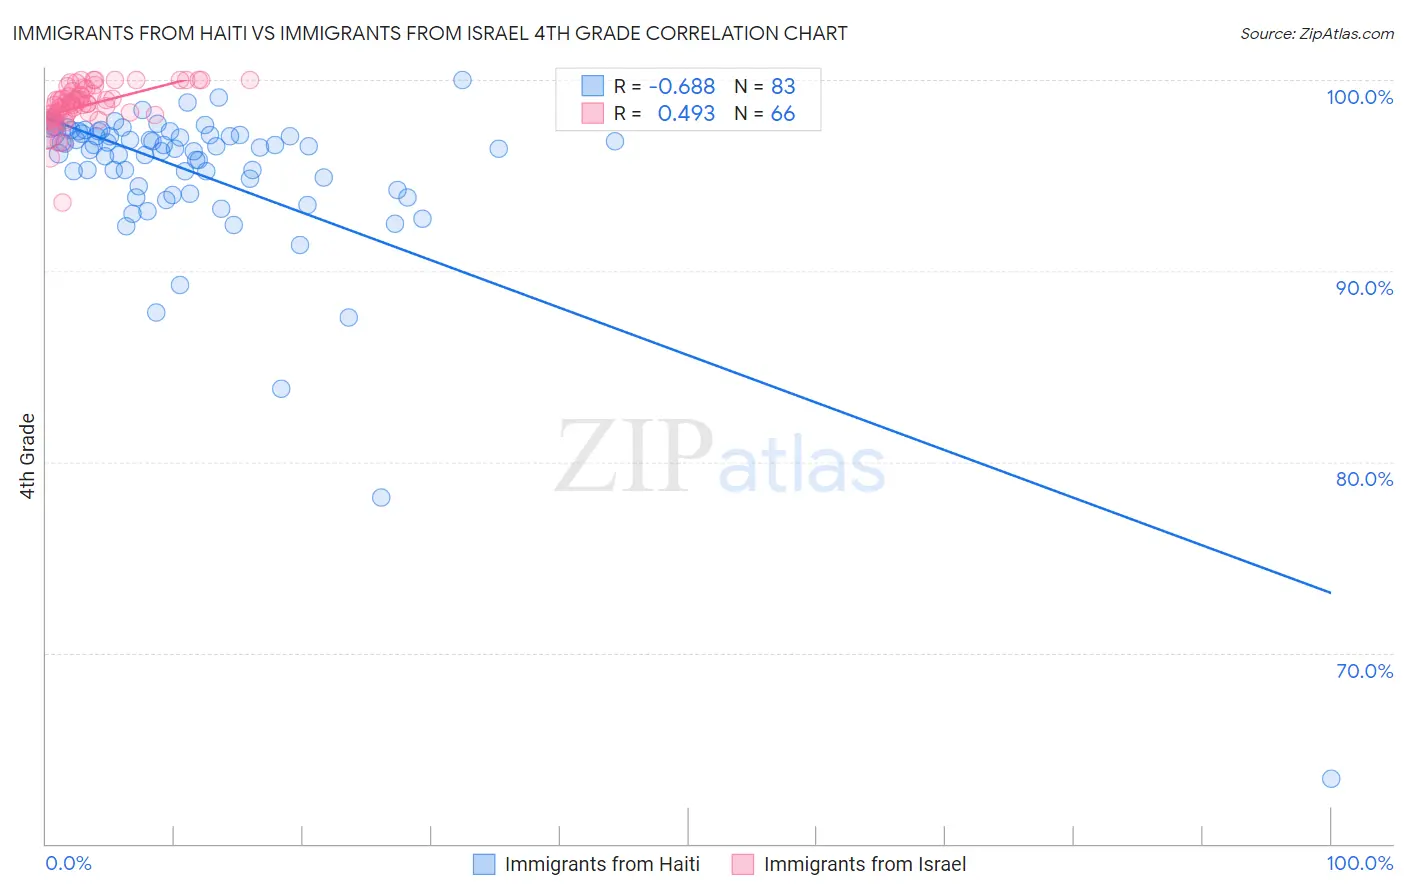
Immigrants from Haiti vs Immigrants from Israel 4th Grade Correlation Chart
The statistical analysis conducted on geographies consisting of 225,286,718 people shows a significant negative correlation between the proportion of Immigrants from Haiti and percentage of population with at least 4th grade education in the United States with a correlation coefficient (R) of -0.688 and weighted average of 96.3%. Similarly, the statistical analysis conducted on geographies consisting of 210,029,773 people shows a moderate positive correlation between the proportion of Immigrants from Israel and percentage of population with at least 4th grade education in the United States with a correlation coefficient (R) of 0.493 and weighted average of 97.6%, a difference of 1.4%.
4th Grade Correlation Summary
| Measurement | Immigrants from Haiti | Immigrants from Israel |
| Minimum | 63.4% | 93.6% |
| Maximum | 100.0% | 100.0% |
| Range | 36.6% | 6.4% |
| Mean | 95.0% | 98.7% |
| Median | 96.4% | 98.8% |
| Interquartile 25% (IQ1) | 94.2% | 98.1% |
| Interquartile 75% (IQ3) | 97.1% | 99.4% |
| Interquartile Range (IQR) | 2.9% | 1.2% |
| Standard Deviation (Sample) | 4.8% | 1.1% |
| Standard Deviation (Population) | 4.7% | 1.1% |
Similar Demographics by 4th Grade
Demographics Similar to Immigrants from Haiti by 4th Grade
In terms of 4th grade, the demographic groups most similar to Immigrants from Haiti are Immigrants from Laos (96.3%, a difference of 0.010%), Immigrants from Guyana (96.3%, a difference of 0.010%), Sri Lankan (96.4%, a difference of 0.030%), Immigrants from Caribbean (96.4%, a difference of 0.040%), and Immigrants from Burma/Myanmar (96.3%, a difference of 0.040%).
| Demographics | Rating | Rank | 4th Grade |
| Immigrants | South Eastern Asia | 0.0 /100 | #300 | Tragic 96.5% |
| Immigrants | Immigrants | 0.0 /100 | #301 | Tragic 96.5% |
| Immigrants | Cuba | 0.0 /100 | #302 | Tragic 96.4% |
| Guyanese | 0.0 /100 | #303 | Tragic 96.4% |
| Ecuadorians | 0.0 /100 | #304 | Tragic 96.4% |
| Immigrants | Caribbean | 0.0 /100 | #305 | Tragic 96.4% |
| Sri Lankans | 0.0 /100 | #306 | Tragic 96.4% |
| Immigrants | Haiti | 0.0 /100 | #307 | Tragic 96.3% |
| Immigrants | Laos | 0.0 /100 | #308 | Tragic 96.3% |
| Immigrants | Guyana | 0.0 /100 | #309 | Tragic 96.3% |
| Immigrants | Burma/Myanmar | 0.0 /100 | #310 | Tragic 96.3% |
| Immigrants | Bangladesh | 0.0 /100 | #311 | Tragic 96.2% |
| Cape Verdeans | 0.0 /100 | #312 | Tragic 96.2% |
| Indonesians | 0.0 /100 | #313 | Tragic 96.2% |
| Vietnamese | 0.0 /100 | #314 | Tragic 96.2% |
Demographics Similar to Immigrants from Israel by 4th Grade
In terms of 4th grade, the demographic groups most similar to Immigrants from Israel are Soviet Union (97.6%, a difference of 0.0%), Alsatian (97.6%, a difference of 0.0%), Immigrants from South Central Asia (97.6%, a difference of 0.010%), Jordanian (97.7%, a difference of 0.020%), and Ute (97.7%, a difference of 0.020%).
| Demographics | Rating | Rank | 4th Grade |
| Burmese | 82.8 /100 | #143 | Excellent 97.7% |
| Spaniards | 82.7 /100 | #144 | Excellent 97.7% |
| Immigrants | Moldova | 82.4 /100 | #145 | Excellent 97.7% |
| Jordanians | 81.3 /100 | #146 | Excellent 97.7% |
| Ute | 80.6 /100 | #147 | Excellent 97.7% |
| Hopi | 80.6 /100 | #148 | Excellent 97.7% |
| Soviet Union | 77.8 /100 | #149 | Good 97.6% |
| Immigrants | Israel | 77.7 /100 | #150 | Good 97.6% |
| Alsatians | 77.2 /100 | #151 | Good 97.6% |
| Immigrants | South Central Asia | 76.2 /100 | #152 | Good 97.6% |
| Immigrants | Eastern Europe | 71.3 /100 | #153 | Good 97.6% |
| Immigrants | Russia | 67.0 /100 | #154 | Good 97.6% |
| Albanians | 67.0 /100 | #155 | Good 97.6% |
| Immigrants | Jordan | 66.9 /100 | #156 | Good 97.6% |
| Immigrants | Bosnia and Herzegovina | 66.0 /100 | #157 | Good 97.6% |