Immigrants from Japan vs Palestinian 4th Grade
COMPARE
Immigrants from Japan
Palestinian
4th Grade
4th Grade Comparison
Immigrants from Japan
Palestinians
97.8%
4TH GRADE
94.1/ 100
METRIC RATING
122nd/ 347
METRIC RANK
97.7%
4TH GRADE
88.1/ 100
METRIC RATING
134th/ 347
METRIC RANK
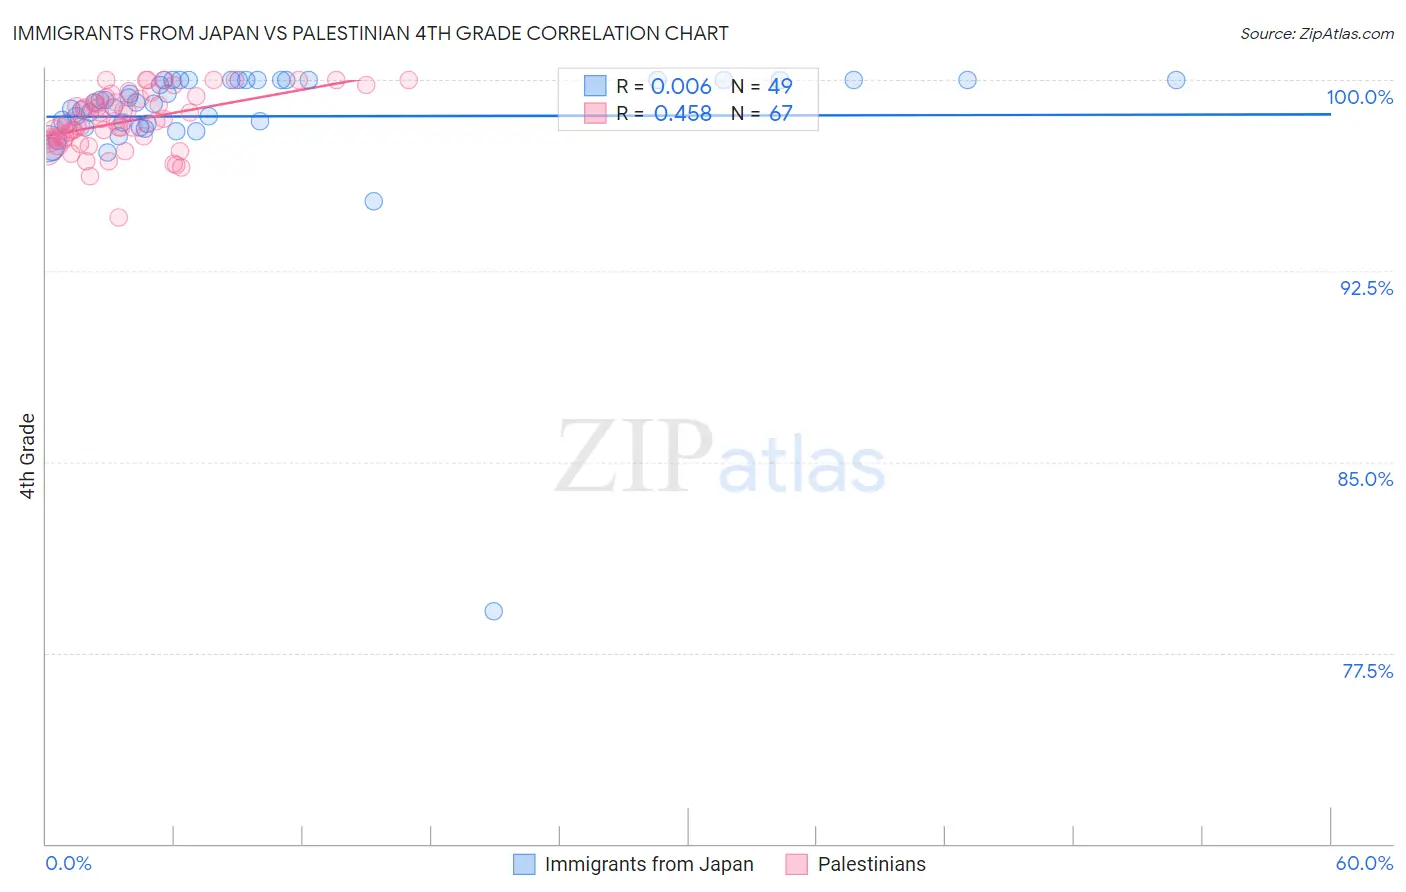
Immigrants from Japan vs Palestinian 4th Grade Correlation Chart
The statistical analysis conducted on geographies consisting of 340,148,942 people shows no correlation between the proportion of Immigrants from Japan and percentage of population with at least 4th grade education in the United States with a correlation coefficient (R) of 0.006 and weighted average of 97.8%. Similarly, the statistical analysis conducted on geographies consisting of 216,424,519 people shows a moderate positive correlation between the proportion of Palestinians and percentage of population with at least 4th grade education in the United States with a correlation coefficient (R) of 0.458 and weighted average of 97.7%, a difference of 0.070%.
4th Grade Correlation Summary
| Measurement | Immigrants from Japan | Palestinian |
| Minimum | 79.1% | 94.6% |
| Maximum | 100.0% | 100.0% |
| Range | 20.9% | 5.4% |
| Mean | 98.6% | 98.4% |
| Median | 99.1% | 98.3% |
| Interquartile 25% (IQ1) | 98.2% | 97.7% |
| Interquartile 75% (IQ3) | 100.0% | 99.3% |
| Interquartile Range (IQR) | 1.8% | 1.6% |
| Standard Deviation (Sample) | 3.0% | 1.1% |
| Standard Deviation (Population) | 3.0% | 1.1% |
Demographics Similar to Immigrants from Japan and Palestinians by 4th Grade
In terms of 4th grade, the demographic groups most similar to Immigrants from Japan are Immigrants from Norway (97.8%, a difference of 0.0%), Immigrants from Zimbabwe (97.8%, a difference of 0.0%), Menominee (97.8%, a difference of 0.010%), Immigrants from Saudi Arabia (97.8%, a difference of 0.010%), and Immigrants from France (97.8%, a difference of 0.010%). Similarly, the demographic groups most similar to Palestinians are Hmong (97.7%, a difference of 0.0%), Cambodian (97.7%, a difference of 0.0%), Immigrants from Hungary (97.7%, a difference of 0.010%), Immigrants from Romania (97.7%, a difference of 0.020%), and Immigrants from Kuwait (97.7%, a difference of 0.020%).
| Demographics | Rating | Rank | 4th Grade |
| Menominee | 94.9 /100 | #118 | Exceptional 97.8% |
| Immigrants | Saudi Arabia | 94.8 /100 | #119 | Exceptional 97.8% |
| Immigrants | France | 94.8 /100 | #120 | Exceptional 97.8% |
| Immigrants | Norway | 94.2 /100 | #121 | Exceptional 97.8% |
| Immigrants | Japan | 94.1 /100 | #122 | Exceptional 97.8% |
| Immigrants | Zimbabwe | 93.9 /100 | #123 | Exceptional 97.8% |
| Spanish | 93.7 /100 | #124 | Exceptional 97.8% |
| Immigrants | Serbia | 92.6 /100 | #125 | Exceptional 97.8% |
| Immigrants | Europe | 92.5 /100 | #126 | Exceptional 97.8% |
| Colville | 92.3 /100 | #127 | Exceptional 97.7% |
| Pima | 92.0 /100 | #128 | Exceptional 97.7% |
| Immigrants | Bulgaria | 91.3 /100 | #129 | Exceptional 97.7% |
| Immigrants | Romania | 90.6 /100 | #130 | Exceptional 97.7% |
| Immigrants | Kuwait | 89.7 /100 | #131 | Excellent 97.7% |
| Immigrants | Hungary | 89.3 /100 | #132 | Excellent 97.7% |
| Hmong | 88.2 /100 | #133 | Excellent 97.7% |
| Palestinians | 88.1 /100 | #134 | Excellent 97.7% |
| Cambodians | 87.8 /100 | #135 | Excellent 97.7% |
| Israelis | 86.2 /100 | #136 | Excellent 97.7% |
| Immigrants | Turkey | 86.0 /100 | #137 | Excellent 97.7% |
| Blackfeet | 86.0 /100 | #138 | Excellent 97.7% |