Belgian vs Immigrants from Israel 4th Grade
COMPARE
Belgian
Immigrants from Israel
4th Grade
4th Grade Comparison
Belgians
Immigrants from Israel
98.2%
4TH GRADE
99.9/ 100
METRIC RATING
39th/ 347
METRIC RANK
97.6%
4TH GRADE
77.7/ 100
METRIC RATING
150th/ 347
METRIC RANK
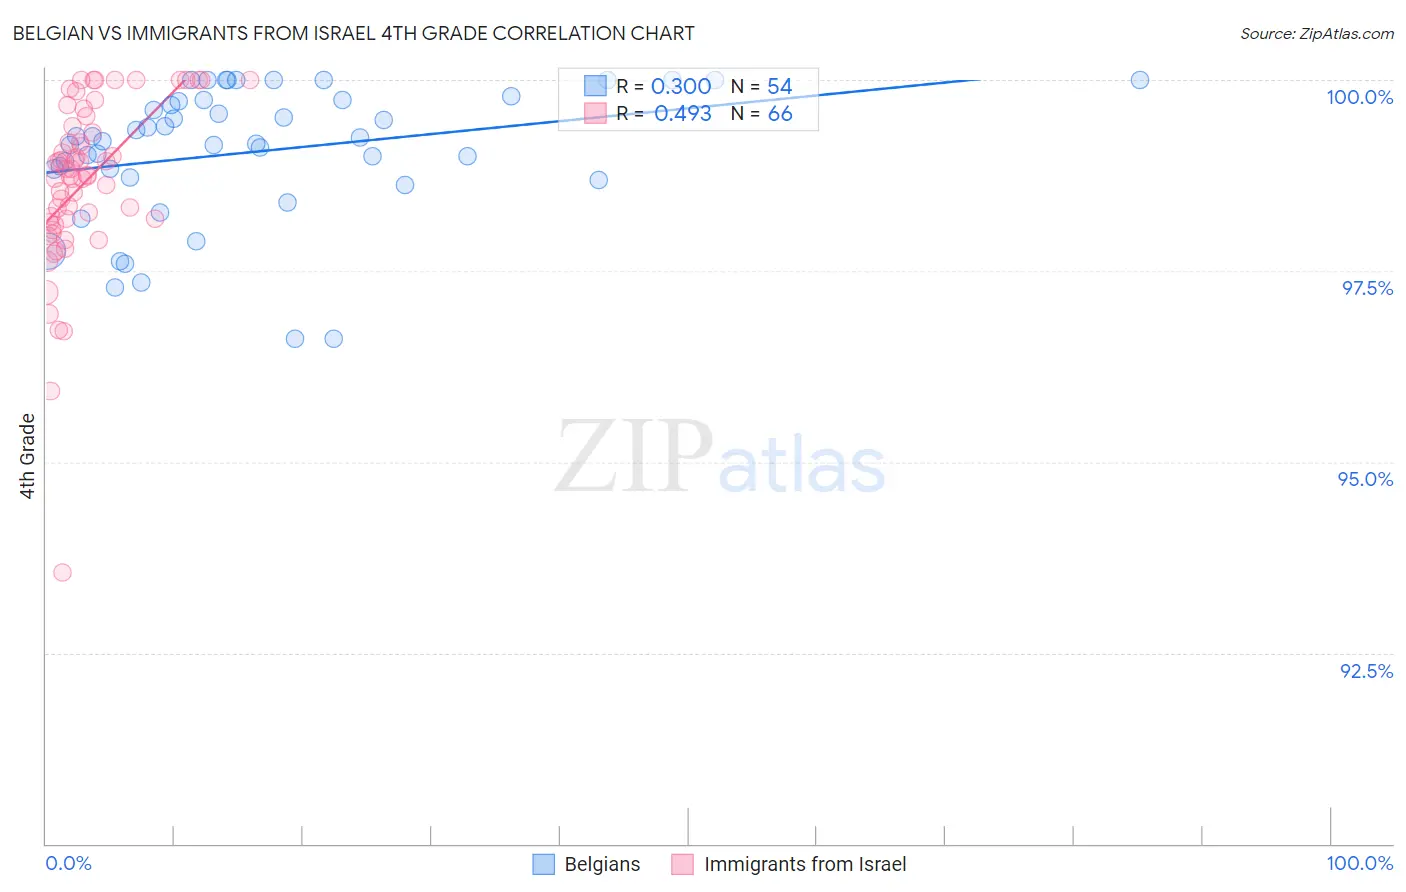
Belgian vs Immigrants from Israel 4th Grade Correlation Chart
The statistical analysis conducted on geographies consisting of 356,016,627 people shows a mild positive correlation between the proportion of Belgians and percentage of population with at least 4th grade education in the United States with a correlation coefficient (R) of 0.300 and weighted average of 98.2%. Similarly, the statistical analysis conducted on geographies consisting of 210,029,773 people shows a moderate positive correlation between the proportion of Immigrants from Israel and percentage of population with at least 4th grade education in the United States with a correlation coefficient (R) of 0.493 and weighted average of 97.6%, a difference of 0.57%.
4th Grade Correlation Summary
| Measurement | Belgian | Immigrants from Israel |
| Minimum | 96.6% | 93.6% |
| Maximum | 100.0% | 100.0% |
| Range | 3.4% | 6.4% |
| Mean | 99.1% | 98.7% |
| Median | 99.2% | 98.8% |
| Interquartile 25% (IQ1) | 98.7% | 98.1% |
| Interquartile 75% (IQ3) | 99.7% | 99.4% |
| Interquartile Range (IQR) | 1.0% | 1.2% |
| Standard Deviation (Sample) | 0.88% | 1.1% |
| Standard Deviation (Population) | 0.87% | 1.1% |
Similar Demographics by 4th Grade
Demographics Similar to Belgians by 4th Grade
In terms of 4th grade, the demographic groups most similar to Belgians are Luxembourger (98.2%, a difference of 0.0%), Latvian (98.2%, a difference of 0.010%), Aleut (98.2%, a difference of 0.010%), Eastern European (98.2%, a difference of 0.010%), and British (98.2%, a difference of 0.030%).
| Demographics | Rating | Rank | 4th Grade |
| Chinese | 100.0 /100 | #32 | Exceptional 98.3% |
| Swiss | 100.0 /100 | #33 | Exceptional 98.2% |
| Chippewa | 100.0 /100 | #34 | Exceptional 98.2% |
| Italians | 100.0 /100 | #35 | Exceptional 98.2% |
| British | 100.0 /100 | #36 | Exceptional 98.2% |
| Latvians | 99.9 /100 | #37 | Exceptional 98.2% |
| Aleuts | 99.9 /100 | #38 | Exceptional 98.2% |
| Belgians | 99.9 /100 | #39 | Exceptional 98.2% |
| Luxembourgers | 99.9 /100 | #40 | Exceptional 98.2% |
| Eastern Europeans | 99.9 /100 | #41 | Exceptional 98.2% |
| Hungarians | 99.9 /100 | #42 | Exceptional 98.2% |
| Northern Europeans | 99.9 /100 | #43 | Exceptional 98.2% |
| Native Hawaiians | 99.9 /100 | #44 | Exceptional 98.1% |
| Czechoslovakians | 99.9 /100 | #45 | Exceptional 98.1% |
| Ottawa | 99.9 /100 | #46 | Exceptional 98.1% |
Demographics Similar to Immigrants from Israel by 4th Grade
In terms of 4th grade, the demographic groups most similar to Immigrants from Israel are Soviet Union (97.6%, a difference of 0.0%), Alsatian (97.6%, a difference of 0.0%), Immigrants from South Central Asia (97.6%, a difference of 0.010%), Jordanian (97.7%, a difference of 0.020%), and Ute (97.7%, a difference of 0.020%).
| Demographics | Rating | Rank | 4th Grade |
| Burmese | 82.8 /100 | #143 | Excellent 97.7% |
| Spaniards | 82.7 /100 | #144 | Excellent 97.7% |
| Immigrants | Moldova | 82.4 /100 | #145 | Excellent 97.7% |
| Jordanians | 81.3 /100 | #146 | Excellent 97.7% |
| Ute | 80.6 /100 | #147 | Excellent 97.7% |
| Hopi | 80.6 /100 | #148 | Excellent 97.7% |
| Soviet Union | 77.8 /100 | #149 | Good 97.6% |
| Immigrants | Israel | 77.7 /100 | #150 | Good 97.6% |
| Alsatians | 77.2 /100 | #151 | Good 97.6% |
| Immigrants | South Central Asia | 76.2 /100 | #152 | Good 97.6% |
| Immigrants | Eastern Europe | 71.3 /100 | #153 | Good 97.6% |
| Immigrants | Russia | 67.0 /100 | #154 | Good 97.6% |
| Albanians | 67.0 /100 | #155 | Good 97.6% |
| Immigrants | Jordan | 66.9 /100 | #156 | Good 97.6% |
| Immigrants | Bosnia and Herzegovina | 66.0 /100 | #157 | Good 97.6% |