Yugoslavian vs Immigrants from Israel 4th Grade
COMPARE
Yugoslavian
Immigrants from Israel
4th Grade
4th Grade Comparison
Yugoslavians
Immigrants from Israel
97.9%
4TH GRADE
98.1/ 100
METRIC RATING
100th/ 347
METRIC RANK
97.6%
4TH GRADE
77.7/ 100
METRIC RATING
150th/ 347
METRIC RANK
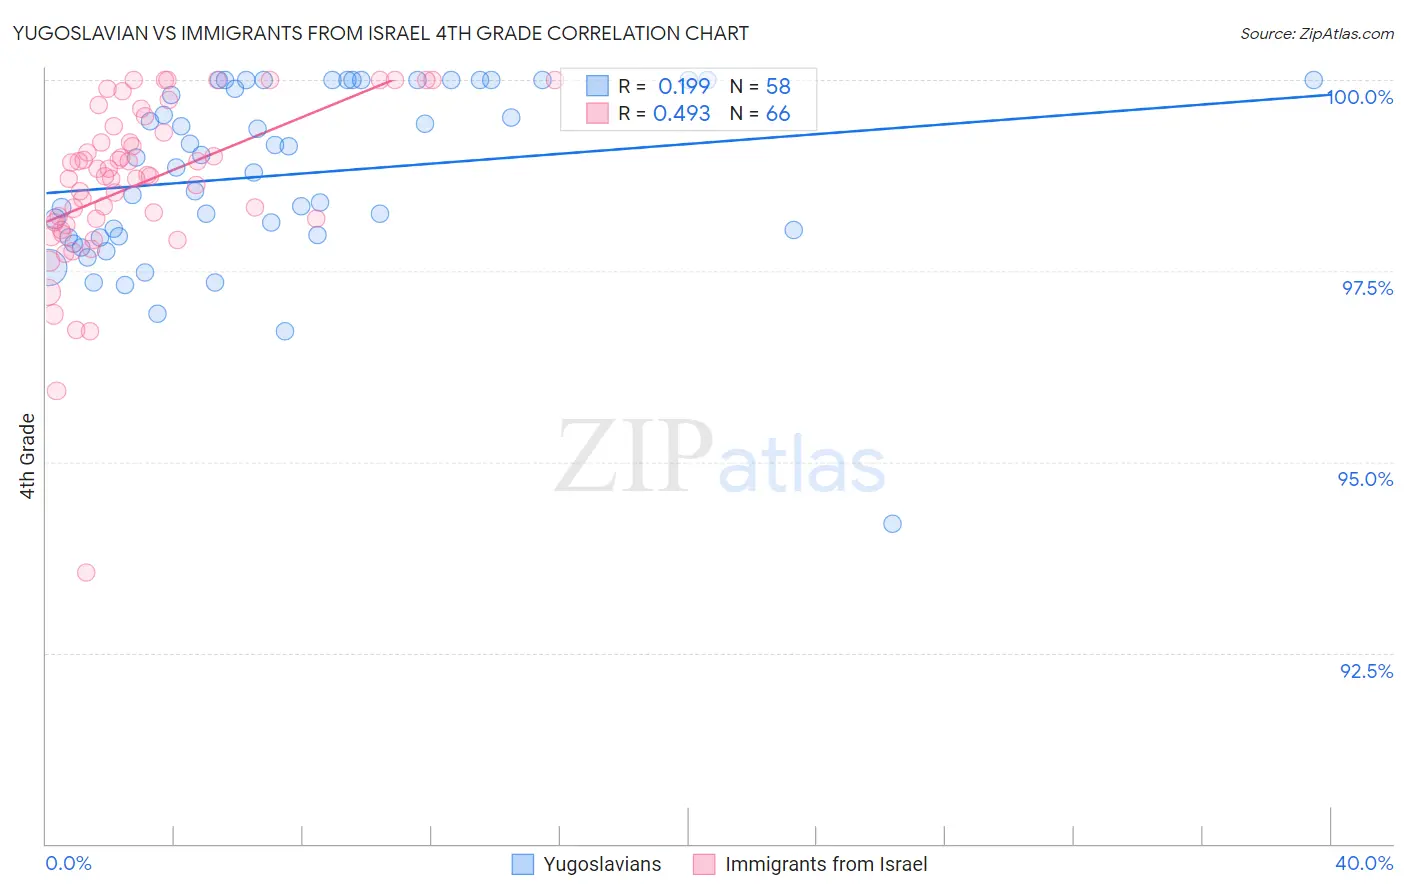
Yugoslavian vs Immigrants from Israel 4th Grade Correlation Chart
The statistical analysis conducted on geographies consisting of 285,618,157 people shows a poor positive correlation between the proportion of Yugoslavians and percentage of population with at least 4th grade education in the United States with a correlation coefficient (R) of 0.199 and weighted average of 97.9%. Similarly, the statistical analysis conducted on geographies consisting of 210,029,773 people shows a moderate positive correlation between the proportion of Immigrants from Israel and percentage of population with at least 4th grade education in the United States with a correlation coefficient (R) of 0.493 and weighted average of 97.6%, a difference of 0.26%.
4th Grade Correlation Summary
| Measurement | Yugoslavian | Immigrants from Israel |
| Minimum | 94.2% | 93.6% |
| Maximum | 100.0% | 100.0% |
| Range | 5.8% | 6.4% |
| Mean | 98.8% | 98.7% |
| Median | 98.9% | 98.8% |
| Interquartile 25% (IQ1) | 97.9% | 98.1% |
| Interquartile 75% (IQ3) | 100.0% | 99.4% |
| Interquartile Range (IQR) | 2.1% | 1.2% |
| Standard Deviation (Sample) | 1.2% | 1.1% |
| Standard Deviation (Population) | 1.2% | 1.1% |
Similar Demographics by 4th Grade
Demographics Similar to Yugoslavians by 4th Grade
In terms of 4th grade, the demographic groups most similar to Yugoslavians are Turkish (97.9%, a difference of 0.0%), Cree (97.9%, a difference of 0.0%), Cheyenne (97.9%, a difference of 0.010%), South African (97.9%, a difference of 0.010%), and Choctaw (97.9%, a difference of 0.010%).
| Demographics | Rating | Rank | 4th Grade |
| Immigrants | Ireland | 98.7 /100 | #93 | Exceptional 97.9% |
| Shoshone | 98.7 /100 | #94 | Exceptional 97.9% |
| Immigrants | Germany | 98.5 /100 | #95 | Exceptional 97.9% |
| Romanians | 98.4 /100 | #96 | Exceptional 97.9% |
| Cheyenne | 98.4 /100 | #97 | Exceptional 97.9% |
| South Africans | 98.2 /100 | #98 | Exceptional 97.9% |
| Turks | 98.2 /100 | #99 | Exceptional 97.9% |
| Yugoslavians | 98.1 /100 | #100 | Exceptional 97.9% |
| Cree | 98.1 /100 | #101 | Exceptional 97.9% |
| Choctaw | 97.9 /100 | #102 | Exceptional 97.9% |
| Puget Sound Salish | 97.7 /100 | #103 | Exceptional 97.9% |
| Immigrants | Nonimmigrants | 97.5 /100 | #104 | Exceptional 97.9% |
| German Russians | 97.5 /100 | #105 | Exceptional 97.9% |
| Immigrants | Czechoslovakia | 97.5 /100 | #106 | Exceptional 97.9% |
| Bhutanese | 97.4 /100 | #107 | Exceptional 97.9% |
Demographics Similar to Immigrants from Israel by 4th Grade
In terms of 4th grade, the demographic groups most similar to Immigrants from Israel are Soviet Union (97.6%, a difference of 0.0%), Alsatian (97.6%, a difference of 0.0%), Immigrants from South Central Asia (97.6%, a difference of 0.010%), Jordanian (97.7%, a difference of 0.020%), and Ute (97.7%, a difference of 0.020%).
| Demographics | Rating | Rank | 4th Grade |
| Burmese | 82.8 /100 | #143 | Excellent 97.7% |
| Spaniards | 82.7 /100 | #144 | Excellent 97.7% |
| Immigrants | Moldova | 82.4 /100 | #145 | Excellent 97.7% |
| Jordanians | 81.3 /100 | #146 | Excellent 97.7% |
| Ute | 80.6 /100 | #147 | Excellent 97.7% |
| Hopi | 80.6 /100 | #148 | Excellent 97.7% |
| Soviet Union | 77.8 /100 | #149 | Good 97.6% |
| Immigrants | Israel | 77.7 /100 | #150 | Good 97.6% |
| Alsatians | 77.2 /100 | #151 | Good 97.6% |
| Immigrants | South Central Asia | 76.2 /100 | #152 | Good 97.6% |
| Immigrants | Eastern Europe | 71.3 /100 | #153 | Good 97.6% |
| Immigrants | Russia | 67.0 /100 | #154 | Good 97.6% |
| Albanians | 67.0 /100 | #155 | Good 97.6% |
| Immigrants | Jordan | 66.9 /100 | #156 | Good 97.6% |
| Immigrants | Bosnia and Herzegovina | 66.0 /100 | #157 | Good 97.6% |