Immigrants from Haiti vs Immigrants from North America GED/Equivalency
COMPARE
Immigrants from Haiti
Immigrants from North America
GED/Equivalency
GED/Equivalency Comparison
Immigrants from Haiti
Immigrants from North America
81.6%
GED/EQUIVALENCY
0.0/ 100
METRIC RATING
302nd/ 347
METRIC RANK
87.8%
GED/EQUIVALENCY
99.1/ 100
METRIC RATING
65th/ 347
METRIC RANK
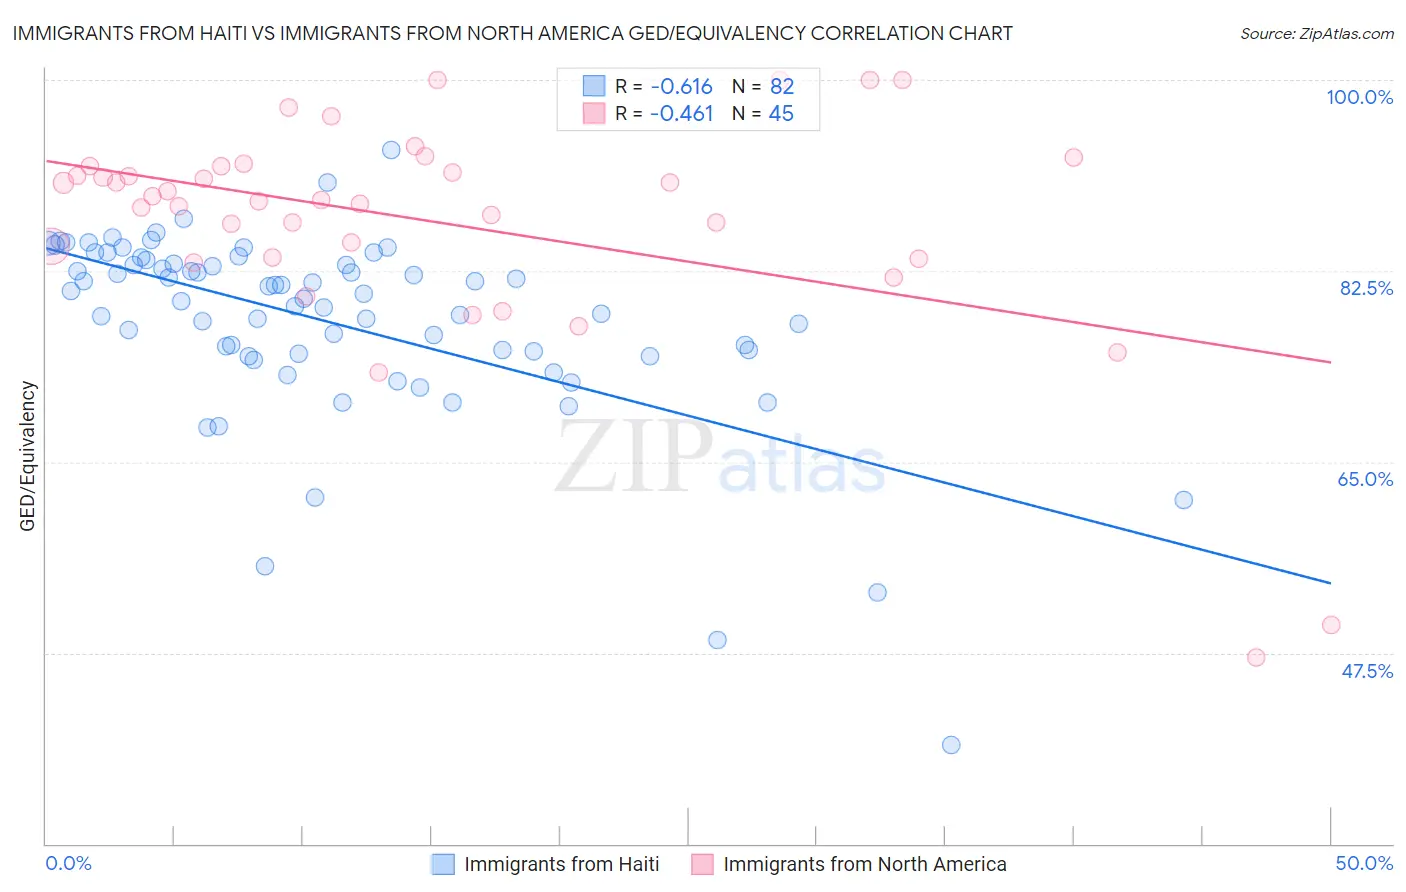
Immigrants from Haiti vs Immigrants from North America GED/Equivalency Correlation Chart
The statistical analysis conducted on geographies consisting of 225,286,636 people shows a significant negative correlation between the proportion of Immigrants from Haiti and percentage of population with at least ged/equivalency education in the United States with a correlation coefficient (R) of -0.616 and weighted average of 81.6%. Similarly, the statistical analysis conducted on geographies consisting of 462,461,910 people shows a moderate negative correlation between the proportion of Immigrants from North America and percentage of population with at least ged/equivalency education in the United States with a correlation coefficient (R) of -0.461 and weighted average of 87.8%, a difference of 7.7%.
GED/Equivalency Correlation Summary
| Measurement | Immigrants from Haiti | Immigrants from North America |
| Minimum | 39.0% | 47.1% |
| Maximum | 93.6% | 100.0% |
| Range | 54.6% | 52.9% |
| Mean | 77.8% | 86.9% |
| Median | 80.2% | 89.0% |
| Interquartile 25% (IQ1) | 74.9% | 83.7% |
| Interquartile 75% (IQ3) | 83.1% | 92.1% |
| Interquartile Range (IQR) | 8.2% | 8.4% |
| Standard Deviation (Sample) | 8.8% | 10.5% |
| Standard Deviation (Population) | 8.8% | 10.4% |
Similar Demographics by GED/Equivalency
Demographics Similar to Immigrants from Haiti by GED/Equivalency
In terms of ged/equivalency, the demographic groups most similar to Immigrants from Haiti are Immigrants from Portugal (81.6%, a difference of 0.0%), Dutch West Indian (81.6%, a difference of 0.040%), Fijian (81.6%, a difference of 0.10%), Navajo (81.5%, a difference of 0.10%), and Ecuadorian (81.7%, a difference of 0.16%).
| Demographics | Rating | Rank | GED/Equivalency |
| Nepalese | 0.0 /100 | #295 | Tragic 81.9% |
| Vietnamese | 0.0 /100 | #296 | Tragic 81.9% |
| Immigrants | Bangladesh | 0.0 /100 | #297 | Tragic 81.9% |
| Ute | 0.0 /100 | #298 | Tragic 81.8% |
| Ecuadorians | 0.0 /100 | #299 | Tragic 81.7% |
| Fijians | 0.0 /100 | #300 | Tragic 81.6% |
| Dutch West Indians | 0.0 /100 | #301 | Tragic 81.6% |
| Immigrants | Haiti | 0.0 /100 | #302 | Tragic 81.6% |
| Immigrants | Portugal | 0.0 /100 | #303 | Tragic 81.6% |
| Navajo | 0.0 /100 | #304 | Tragic 81.5% |
| Immigrants | Grenada | 0.0 /100 | #305 | Tragic 81.3% |
| Guyanese | 0.0 /100 | #306 | Tragic 81.3% |
| Immigrants | Dominica | 0.0 /100 | #307 | Tragic 81.1% |
| Puerto Ricans | 0.0 /100 | #308 | Tragic 81.1% |
| Immigrants | Ecuador | 0.0 /100 | #309 | Tragic 81.0% |
Demographics Similar to Immigrants from North America by GED/Equivalency
In terms of ged/equivalency, the demographic groups most similar to Immigrants from North America are Immigrants from Bulgaria (87.8%, a difference of 0.0%), British (87.8%, a difference of 0.010%), Immigrants from France (87.8%, a difference of 0.020%), Immigrants from Canada (87.9%, a difference of 0.030%), and Immigrants from Turkey (87.9%, a difference of 0.070%).
| Demographics | Rating | Rank | GED/Equivalency |
| Northern Europeans | 99.3 /100 | #58 | Exceptional 87.9% |
| Serbians | 99.3 /100 | #59 | Exceptional 87.9% |
| Scandinavians | 99.3 /100 | #60 | Exceptional 87.9% |
| Europeans | 99.3 /100 | #61 | Exceptional 87.9% |
| Germans | 99.3 /100 | #62 | Exceptional 87.9% |
| Immigrants | Turkey | 99.2 /100 | #63 | Exceptional 87.9% |
| Immigrants | Canada | 99.2 /100 | #64 | Exceptional 87.9% |
| Immigrants | North America | 99.1 /100 | #65 | Exceptional 87.8% |
| Immigrants | Bulgaria | 99.1 /100 | #66 | Exceptional 87.8% |
| British | 99.1 /100 | #67 | Exceptional 87.8% |
| Immigrants | France | 99.1 /100 | #68 | Exceptional 87.8% |
| Immigrants | Saudi Arabia | 99.0 /100 | #69 | Exceptional 87.8% |
| Ukrainians | 98.8 /100 | #70 | Exceptional 87.7% |
| Austrians | 98.8 /100 | #71 | Exceptional 87.7% |
| Immigrants | Moldova | 98.8 /100 | #72 | Exceptional 87.7% |