Immigrants from Guyana vs Paraguayan College, Under 1 year
COMPARE
Immigrants from Guyana
Paraguayan
College, Under 1 year
College, Under 1 year Comparison
Immigrants from Guyana
Paraguayans
58.5%
COLLEGE, UNDER 1 YEAR
0.0/ 100
METRIC RATING
300th/ 347
METRIC RANK
67.9%
COLLEGE, UNDER 1 YEAR
97.1/ 100
METRIC RATING
98th/ 347
METRIC RANK
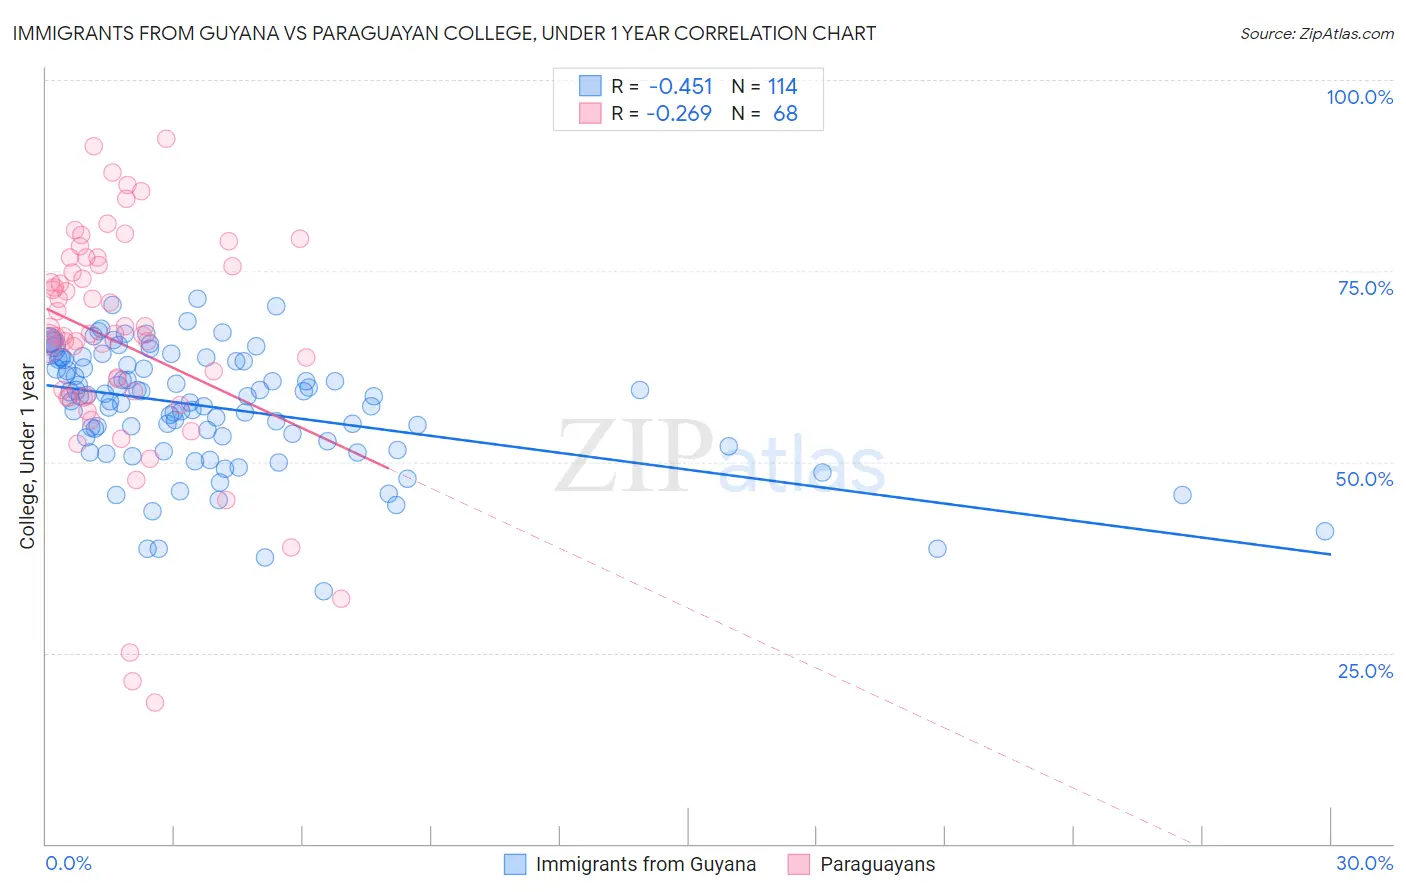
Immigrants from Guyana vs Paraguayan College, Under 1 year Correlation Chart
The statistical analysis conducted on geographies consisting of 183,735,121 people shows a moderate negative correlation between the proportion of Immigrants from Guyana and percentage of population with at least college, under 1 year education in the United States with a correlation coefficient (R) of -0.451 and weighted average of 58.5%. Similarly, the statistical analysis conducted on geographies consisting of 95,113,072 people shows a weak negative correlation between the proportion of Paraguayans and percentage of population with at least college, under 1 year education in the United States with a correlation coefficient (R) of -0.269 and weighted average of 67.9%, a difference of 16.2%.
College, Under 1 year Correlation Summary
| Measurement | Immigrants from Guyana | Paraguayan |
| Minimum | 33.1% | 18.4% |
| Maximum | 71.3% | 92.3% |
| Range | 38.3% | 73.8% |
| Mean | 57.1% | 65.7% |
| Median | 58.5% | 66.7% |
| Interquartile 25% (IQ1) | 52.6% | 58.5% |
| Interquartile 75% (IQ3) | 63.2% | 75.7% |
| Interquartile Range (IQR) | 10.6% | 17.1% |
| Standard Deviation (Sample) | 7.8% | 15.1% |
| Standard Deviation (Population) | 7.8% | 15.0% |
Similar Demographics by College, Under 1 year
Demographics Similar to Immigrants from Guyana by College, Under 1 year
In terms of college, under 1 year, the demographic groups most similar to Immigrants from Guyana are Cuban (58.6%, a difference of 0.26%), Immigrants from Ecuador (58.7%, a difference of 0.39%), Mexican American Indian (58.1%, a difference of 0.62%), Apache (58.0%, a difference of 0.81%), and Guyanese (59.0%, a difference of 0.89%).
| Demographics | Rating | Rank | College, Under 1 year |
| Seminole | 0.0 /100 | #293 | Tragic 59.1% |
| Immigrants | Belize | 0.0 /100 | #294 | Tragic 59.1% |
| Immigrants | Grenada | 0.0 /100 | #295 | Tragic 59.1% |
| Central American Indians | 0.0 /100 | #296 | Tragic 59.0% |
| Guyanese | 0.0 /100 | #297 | Tragic 59.0% |
| Immigrants | Ecuador | 0.0 /100 | #298 | Tragic 58.7% |
| Cubans | 0.0 /100 | #299 | Tragic 58.6% |
| Immigrants | Guyana | 0.0 /100 | #300 | Tragic 58.5% |
| Mexican American Indians | 0.0 /100 | #301 | Tragic 58.1% |
| Apache | 0.0 /100 | #302 | Tragic 58.0% |
| Immigrants | Dominica | 0.0 /100 | #303 | Tragic 57.9% |
| Kiowa | 0.0 /100 | #304 | Tragic 57.8% |
| Haitians | 0.0 /100 | #305 | Tragic 57.8% |
| Immigrants | Portugal | 0.0 /100 | #306 | Tragic 57.7% |
| Fijians | 0.0 /100 | #307 | Tragic 57.7% |
Demographics Similar to Paraguayans by College, Under 1 year
In terms of college, under 1 year, the demographic groups most similar to Paraguayans are Immigrants from Bolivia (67.9%, a difference of 0.020%), Immigrants from Argentina (67.9%, a difference of 0.030%), Immigrants from Eastern Europe (67.9%, a difference of 0.080%), Palestinian (67.9%, a difference of 0.080%), and Carpatho Rusyn (67.9%, a difference of 0.090%).
| Demographics | Rating | Rank | College, Under 1 year |
| Europeans | 98.1 /100 | #91 | Exceptional 68.2% |
| Luxembourgers | 98.1 /100 | #92 | Exceptional 68.2% |
| Romanians | 97.9 /100 | #93 | Exceptional 68.2% |
| Armenians | 97.7 /100 | #94 | Exceptional 68.1% |
| Immigrants | Pakistan | 97.5 /100 | #95 | Exceptional 68.0% |
| Jordanians | 97.4 /100 | #96 | Exceptional 68.0% |
| Immigrants | Ethiopia | 97.3 /100 | #97 | Exceptional 68.0% |
| Paraguayans | 97.1 /100 | #98 | Exceptional 67.9% |
| Immigrants | Bolivia | 97.0 /100 | #99 | Exceptional 67.9% |
| Immigrants | Argentina | 97.0 /100 | #100 | Exceptional 67.9% |
| Immigrants | Eastern Europe | 96.9 /100 | #101 | Exceptional 67.9% |
| Palestinians | 96.9 /100 | #102 | Exceptional 67.9% |
| Carpatho Rusyns | 96.8 /100 | #103 | Exceptional 67.9% |
| Immigrants | Western Asia | 96.6 /100 | #104 | Exceptional 67.8% |
| Afghans | 96.6 /100 | #105 | Exceptional 67.8% |