Immigrants from Guyana vs Paraguayan Hearing Disability
COMPARE
Immigrants from Guyana
Paraguayan
Hearing Disability
Hearing Disability Comparison
Immigrants from Guyana
Paraguayans
2.3%
HEARING DISABILITY
100.0/ 100
METRIC RATING
4th/ 347
METRIC RANK
2.7%
HEARING DISABILITY
99.2/ 100
METRIC RATING
50th/ 347
METRIC RANK
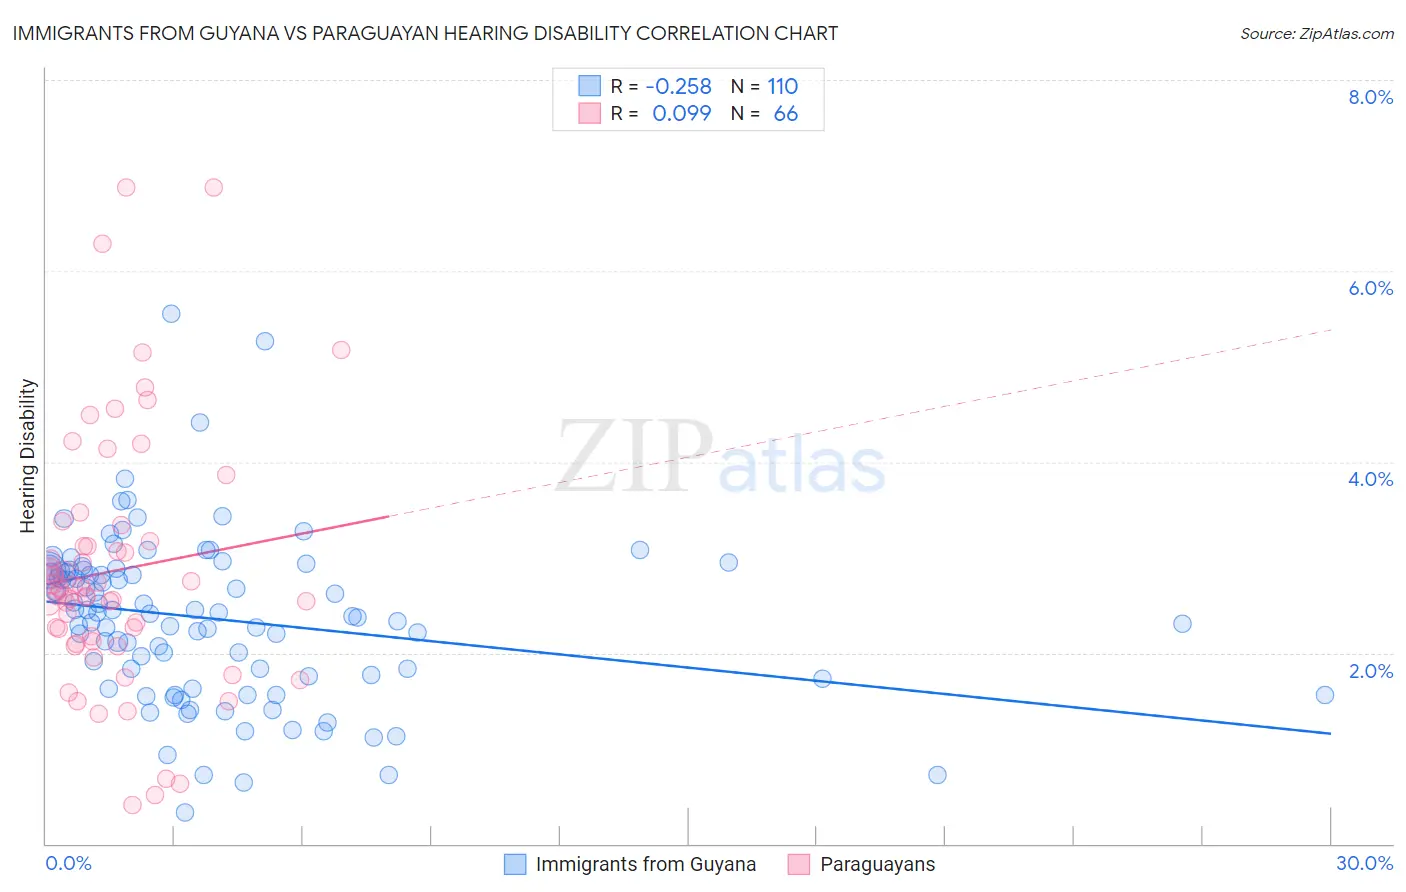
Immigrants from Guyana vs Paraguayan Hearing Disability Correlation Chart
The statistical analysis conducted on geographies consisting of 183,657,050 people shows a weak negative correlation between the proportion of Immigrants from Guyana and percentage of population with hearing disability in the United States with a correlation coefficient (R) of -0.258 and weighted average of 2.3%. Similarly, the statistical analysis conducted on geographies consisting of 95,101,593 people shows a slight positive correlation between the proportion of Paraguayans and percentage of population with hearing disability in the United States with a correlation coefficient (R) of 0.099 and weighted average of 2.7%, a difference of 14.7%.
Hearing Disability Correlation Summary
| Measurement | Immigrants from Guyana | Paraguayan |
| Minimum | 0.33% | 0.40% |
| Maximum | 5.6% | 6.9% |
| Range | 5.2% | 6.5% |
| Mean | 2.4% | 2.9% |
| Median | 2.4% | 2.6% |
| Interquartile 25% (IQ1) | 1.8% | 2.1% |
| Interquartile 75% (IQ3) | 2.9% | 3.2% |
| Interquartile Range (IQR) | 1.1% | 1.0% |
| Standard Deviation (Sample) | 0.87% | 1.3% |
| Standard Deviation (Population) | 0.86% | 1.3% |
Similar Demographics by Hearing Disability
Demographics Similar to Immigrants from Guyana by Hearing Disability
In terms of hearing disability, the demographic groups most similar to Immigrants from Guyana are Guyanese (2.3%, a difference of 1.4%), Immigrants from Barbados (2.4%, a difference of 1.9%), Immigrants from St. Vincent and the Grenadines (2.3%, a difference of 2.8%), Vietnamese (2.4%, a difference of 3.0%), and Immigrants from Bangladesh (2.4%, a difference of 4.6%).
| Demographics | Rating | Rank | Hearing Disability |
| Immigrants | Grenada | 100.0 /100 | #1 | Exceptional 2.2% |
| Immigrants | St. Vincent and the Grenadines | 100.0 /100 | #2 | Exceptional 2.3% |
| Guyanese | 100.0 /100 | #3 | Exceptional 2.3% |
| Immigrants | Guyana | 100.0 /100 | #4 | Exceptional 2.3% |
| Immigrants | Barbados | 100.0 /100 | #5 | Exceptional 2.4% |
| Vietnamese | 100.0 /100 | #6 | Exceptional 2.4% |
| Immigrants | Bangladesh | 100.0 /100 | #7 | Exceptional 2.4% |
| British West Indians | 100.0 /100 | #8 | Exceptional 2.4% |
| Immigrants | Dominican Republic | 100.0 /100 | #9 | Exceptional 2.4% |
| Immigrants | Ecuador | 99.9 /100 | #10 | Exceptional 2.5% |
| Immigrants | Trinidad and Tobago | 99.9 /100 | #11 | Exceptional 2.5% |
| Trinidadians and Tobagonians | 99.9 /100 | #12 | Exceptional 2.5% |
| Sierra Leoneans | 99.9 /100 | #13 | Exceptional 2.5% |
| Ecuadorians | 99.9 /100 | #14 | Exceptional 2.5% |
| Barbadians | 99.9 /100 | #15 | Exceptional 2.5% |
Demographics Similar to Paraguayans by Hearing Disability
In terms of hearing disability, the demographic groups most similar to Paraguayans are Immigrants from Hong Kong (2.7%, a difference of 0.070%), Immigrants from South America (2.7%, a difference of 0.19%), Immigrants from Singapore (2.6%, a difference of 0.31%), Immigrants from Israel (2.6%, a difference of 0.38%), and Jamaican (2.7%, a difference of 0.42%).
| Demographics | Rating | Rank | Hearing Disability |
| Senegalese | 99.4 /100 | #43 | Exceptional 2.6% |
| Nigerians | 99.4 /100 | #44 | Exceptional 2.6% |
| Venezuelans | 99.4 /100 | #45 | Exceptional 2.6% |
| Immigrants | Dominica | 99.3 /100 | #46 | Exceptional 2.6% |
| Immigrants | Israel | 99.3 /100 | #47 | Exceptional 2.6% |
| Immigrants | Singapore | 99.3 /100 | #48 | Exceptional 2.6% |
| Immigrants | South America | 99.2 /100 | #49 | Exceptional 2.7% |
| Paraguayans | 99.2 /100 | #50 | Exceptional 2.7% |
| Immigrants | Hong Kong | 99.2 /100 | #51 | Exceptional 2.7% |
| Jamaicans | 99.0 /100 | #52 | Exceptional 2.7% |
| Immigrants | Eastern Asia | 99.0 /100 | #53 | Exceptional 2.7% |
| Ethiopians | 99.0 /100 | #54 | Exceptional 2.7% |
| Immigrants | Ethiopia | 99.0 /100 | #55 | Exceptional 2.7% |
| Immigrants | Nicaragua | 99.0 /100 | #56 | Exceptional 2.7% |
| South Americans | 99.0 /100 | #57 | Exceptional 2.7% |