Immigrants from Belize vs Spaniard High School Diploma
COMPARE
Immigrants from Belize
Spaniard
High School Diploma
High School Diploma Comparison
Immigrants from Belize
Spaniards
84.2%
HIGH SCHOOL DIPLOMA
0.0/ 100
METRIC RATING
318th/ 347
METRIC RANK
89.1%
HIGH SCHOOL DIPLOMA
43.4/ 100
METRIC RATING
182nd/ 347
METRIC RANK
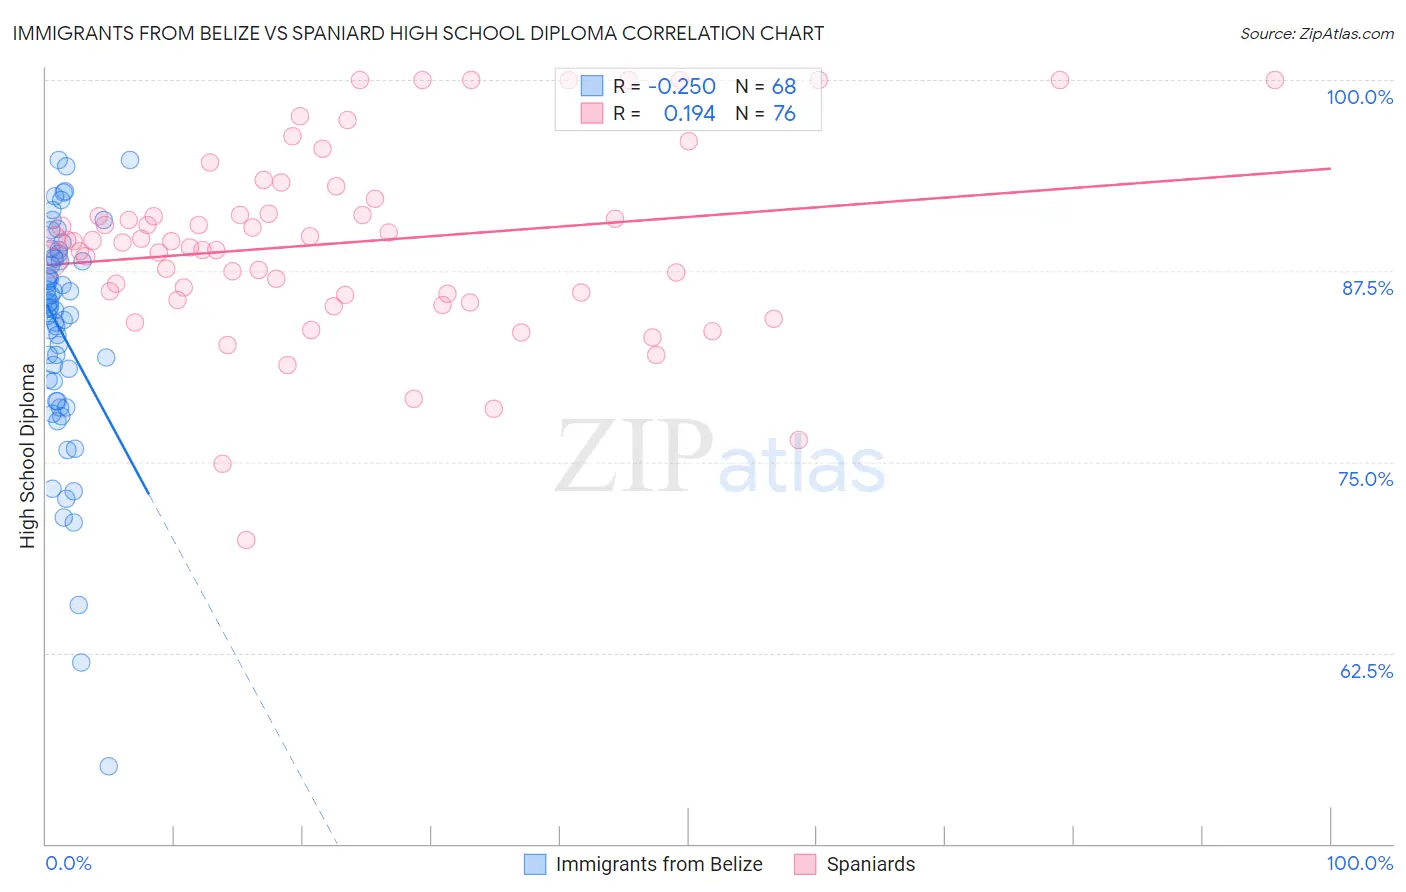
Immigrants from Belize vs Spaniard High School Diploma Correlation Chart
The statistical analysis conducted on geographies consisting of 130,181,087 people shows a weak negative correlation between the proportion of Immigrants from Belize and percentage of population with at least high school diploma education in the United States with a correlation coefficient (R) of -0.250 and weighted average of 84.2%. Similarly, the statistical analysis conducted on geographies consisting of 443,545,794 people shows a poor positive correlation between the proportion of Spaniards and percentage of population with at least high school diploma education in the United States with a correlation coefficient (R) of 0.194 and weighted average of 89.1%, a difference of 5.7%.
High School Diploma Correlation Summary
| Measurement | Immigrants from Belize | Spaniard |
| Minimum | 55.0% | 69.9% |
| Maximum | 94.8% | 100.0% |
| Range | 39.7% | 30.1% |
| Mean | 83.5% | 89.3% |
| Median | 85.1% | 89.5% |
| Interquartile 25% (IQ1) | 79.6% | 86.0% |
| Interquartile 75% (IQ3) | 88.3% | 91.7% |
| Interquartile Range (IQR) | 8.7% | 5.7% |
| Standard Deviation (Sample) | 7.6% | 6.2% |
| Standard Deviation (Population) | 7.5% | 6.1% |
Similar Demographics by High School Diploma
Demographics Similar to Immigrants from Belize by High School Diploma
In terms of high school diploma, the demographic groups most similar to Immigrants from Belize are Central American Indian (84.2%, a difference of 0.040%), Immigrants from Caribbean (84.3%, a difference of 0.070%), Belizean (84.3%, a difference of 0.13%), Nicaraguan (84.1%, a difference of 0.14%), and Yuman (84.0%, a difference of 0.27%).
| Demographics | Rating | Rank | High School Diploma |
| Ecuadorians | 0.0 /100 | #311 | Tragic 85.1% |
| Cape Verdeans | 0.0 /100 | #312 | Tragic 85.1% |
| Immigrants | Ecuador | 0.0 /100 | #313 | Tragic 84.8% |
| Yaqui | 0.0 /100 | #314 | Tragic 84.7% |
| Puerto Ricans | 0.0 /100 | #315 | Tragic 84.7% |
| Belizeans | 0.0 /100 | #316 | Tragic 84.3% |
| Immigrants | Caribbean | 0.0 /100 | #317 | Tragic 84.3% |
| Immigrants | Belize | 0.0 /100 | #318 | Tragic 84.2% |
| Central American Indians | 0.0 /100 | #319 | Tragic 84.2% |
| Nicaraguans | 0.0 /100 | #320 | Tragic 84.1% |
| Yuman | 0.0 /100 | #321 | Tragic 84.0% |
| Lumbee | 0.0 /100 | #322 | Tragic 83.6% |
| Immigrants | Cuba | 0.0 /100 | #323 | Tragic 83.5% |
| Immigrants | Cabo Verde | 0.0 /100 | #324 | Tragic 83.3% |
| Immigrants | Nicaragua | 0.0 /100 | #325 | Tragic 83.1% |
Demographics Similar to Spaniards by High School Diploma
In terms of high school diploma, the demographic groups most similar to Spaniards are Venezuelan (89.1%, a difference of 0.0%), Potawatomi (89.0%, a difference of 0.010%), Bolivian (89.1%, a difference of 0.030%), American (89.1%, a difference of 0.060%), and Immigrants from Syria (89.0%, a difference of 0.060%).
| Demographics | Rating | Rank | High School Diploma |
| Immigrants | Western Asia | 49.0 /100 | #175 | Average 89.1% |
| Osage | 48.9 /100 | #176 | Average 89.1% |
| Sudanese | 48.5 /100 | #177 | Average 89.1% |
| Sierra Leoneans | 48.4 /100 | #178 | Average 89.1% |
| Americans | 47.2 /100 | #179 | Average 89.1% |
| Bolivians | 45.2 /100 | #180 | Average 89.1% |
| Venezuelans | 43.6 /100 | #181 | Average 89.1% |
| Spaniards | 43.4 /100 | #182 | Average 89.1% |
| Potawatomi | 42.5 /100 | #183 | Average 89.0% |
| Immigrants | Syria | 39.2 /100 | #184 | Fair 89.0% |
| Ethiopians | 37.0 /100 | #185 | Fair 89.0% |
| Immigrants | Eastern Africa | 35.8 /100 | #186 | Fair 88.9% |
| Guamanians/Chamorros | 35.5 /100 | #187 | Fair 88.9% |
| Immigrants | Sudan | 33.4 /100 | #188 | Fair 88.9% |
| Immigrants | Uganda | 32.6 /100 | #189 | Fair 88.9% |