Israeli vs Spaniard High School Diploma
COMPARE
Israeli
Spaniard
High School Diploma
High School Diploma Comparison
Israelis
Spaniards
90.1%
HIGH SCHOOL DIPLOMA
95.1/ 100
METRIC RATING
118th/ 347
METRIC RANK
89.1%
HIGH SCHOOL DIPLOMA
43.4/ 100
METRIC RATING
182nd/ 347
METRIC RANK
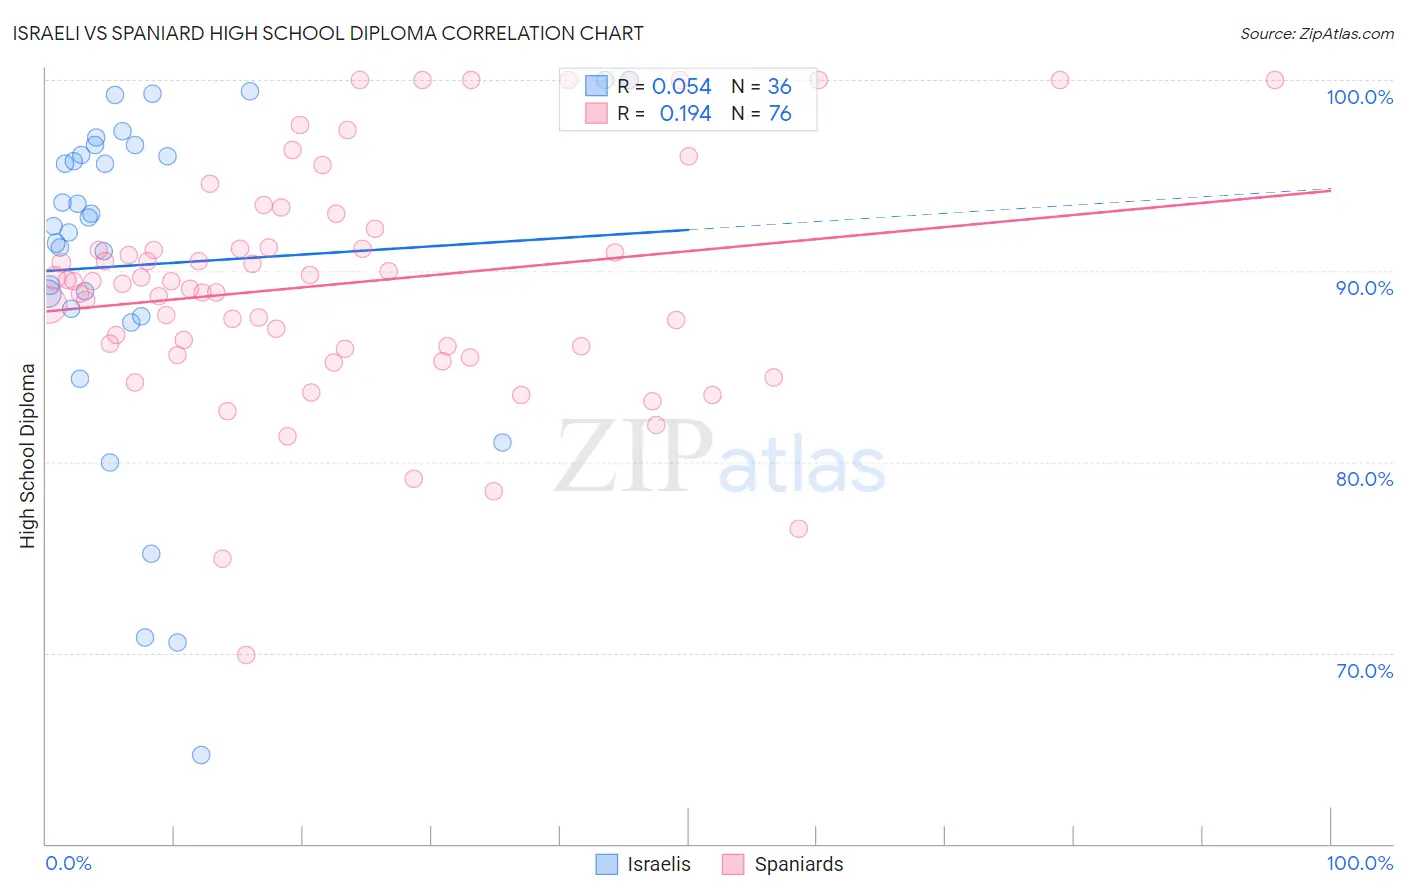
Israeli vs Spaniard High School Diploma Correlation Chart
The statistical analysis conducted on geographies consisting of 211,220,500 people shows a slight positive correlation between the proportion of Israelis and percentage of population with at least high school diploma education in the United States with a correlation coefficient (R) of 0.054 and weighted average of 90.1%. Similarly, the statistical analysis conducted on geographies consisting of 443,545,794 people shows a poor positive correlation between the proportion of Spaniards and percentage of population with at least high school diploma education in the United States with a correlation coefficient (R) of 0.194 and weighted average of 89.1%, a difference of 1.2%.
High School Diploma Correlation Summary
| Measurement | Israeli | Spaniard |
| Minimum | 64.7% | 69.9% |
| Maximum | 100.0% | 100.0% |
| Range | 35.3% | 30.1% |
| Mean | 90.3% | 89.3% |
| Median | 92.6% | 89.5% |
| Interquartile 25% (IQ1) | 87.8% | 86.0% |
| Interquartile 75% (IQ3) | 96.3% | 91.7% |
| Interquartile Range (IQR) | 8.5% | 5.7% |
| Standard Deviation (Sample) | 8.8% | 6.2% |
| Standard Deviation (Population) | 8.7% | 6.1% |
Similar Demographics by High School Diploma
Demographics Similar to Israelis by High School Diploma
In terms of high school diploma, the demographic groups most similar to Israelis are Jordanian (90.2%, a difference of 0.020%), Immigrants from Eastern Europe (90.1%, a difference of 0.020%), Immigrants from Germany (90.2%, a difference of 0.050%), Ottawa (90.1%, a difference of 0.050%), and Immigrants from Hungary (90.2%, a difference of 0.060%).
| Demographics | Rating | Rank | High School Diploma |
| Menominee | 96.6 /100 | #111 | Exceptional 90.3% |
| Immigrants | Belarus | 96.4 /100 | #112 | Exceptional 90.2% |
| Immigrants | Sri Lanka | 96.3 /100 | #113 | Exceptional 90.2% |
| Yugoslavians | 96.2 /100 | #114 | Exceptional 90.2% |
| Immigrants | Hungary | 95.8 /100 | #115 | Exceptional 90.2% |
| Immigrants | Germany | 95.7 /100 | #116 | Exceptional 90.2% |
| Jordanians | 95.4 /100 | #117 | Exceptional 90.2% |
| Israelis | 95.1 /100 | #118 | Exceptional 90.1% |
| Immigrants | Eastern Europe | 94.9 /100 | #119 | Exceptional 90.1% |
| Ottawa | 94.4 /100 | #120 | Exceptional 90.1% |
| Whites/Caucasians | 94.1 /100 | #121 | Exceptional 90.1% |
| Immigrants | Kazakhstan | 93.4 /100 | #122 | Exceptional 90.0% |
| German Russians | 92.0 /100 | #123 | Exceptional 90.0% |
| Mongolians | 91.6 /100 | #124 | Exceptional 89.9% |
| Egyptians | 91.1 /100 | #125 | Exceptional 89.9% |
Demographics Similar to Spaniards by High School Diploma
In terms of high school diploma, the demographic groups most similar to Spaniards are Venezuelan (89.1%, a difference of 0.0%), Potawatomi (89.0%, a difference of 0.010%), Bolivian (89.1%, a difference of 0.030%), American (89.1%, a difference of 0.060%), and Immigrants from Syria (89.0%, a difference of 0.060%).
| Demographics | Rating | Rank | High School Diploma |
| Immigrants | Western Asia | 49.0 /100 | #175 | Average 89.1% |
| Osage | 48.9 /100 | #176 | Average 89.1% |
| Sudanese | 48.5 /100 | #177 | Average 89.1% |
| Sierra Leoneans | 48.4 /100 | #178 | Average 89.1% |
| Americans | 47.2 /100 | #179 | Average 89.1% |
| Bolivians | 45.2 /100 | #180 | Average 89.1% |
| Venezuelans | 43.6 /100 | #181 | Average 89.1% |
| Spaniards | 43.4 /100 | #182 | Average 89.1% |
| Potawatomi | 42.5 /100 | #183 | Average 89.0% |
| Immigrants | Syria | 39.2 /100 | #184 | Fair 89.0% |
| Ethiopians | 37.0 /100 | #185 | Fair 89.0% |
| Immigrants | Eastern Africa | 35.8 /100 | #186 | Fair 88.9% |
| Guamanians/Chamorros | 35.5 /100 | #187 | Fair 88.9% |
| Immigrants | Sudan | 33.4 /100 | #188 | Fair 88.9% |
| Immigrants | Uganda | 32.6 /100 | #189 | Fair 88.9% |